1

I would like to know what the difference between "Leaks" and "Allocations > # Living" shown in Instruments.app of Xcode 5 is. I used iprofiler command to check the memory leaks of my C++ command line application built with Clang++, and opened a .dtps file with Instrunents.app.

$ iprofiler -leaks ./a.out
$ open a.dtps

As you can see in the attached screen shot, there is a large living memory of 166.61 MB. Apple explains that "# Living" is "The number of allocations created during the selected time range and still existing at the end of it." It sounds like that "# Living" indicates the amount of memory leaks.

But I do not see this "leak" in the "Leaks" tab in the application window. What is the difference between "Leaks" and "# Living"?
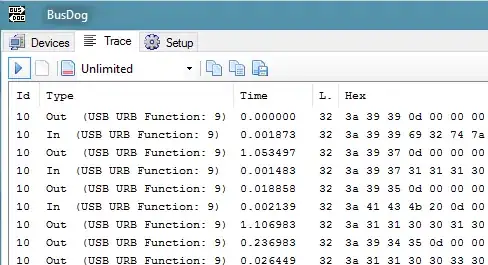
Screen shot of Instruments.app

mfaani
  • 33,269
  • 19
  • 164
  • 293
Akira Okumura
  • 1,816
  • 2
  • 20
  • 41

2 Answers2

2

Allocated and still living objects are those, that are still used by the app and a reference is hold onto. Using this number you may identify objects that you are still holding onto and thus use up memory. The allocation analysis helps you to improve memory usage issues. They are not leaked thug, but still referenced.

Leaks are objects in your app that are no longer referenced and reachable. So objects, that never were freed or dealloc`ed respectively.

Volker
  • 4,640
  • 1
  • 23
  • 31
  • Thank you @Volker. It seems that "# Living" is similar to "still reachable" in Valgrind. This means that I don't need to worry about this, as you commented. – Akira Okumura Feb 17 '14 at 16:17
  • 1
    Exactly. I wouldn't usually worry about them, but you should analyze the living bytes if you are using lots of memory. There may be chance that you could reduce the memory footprint. Yet, do not undertake premature optimization ;) – Volker Feb 17 '14 at 16:20
  • I am reading [this](https://www.raywenderlich.com/97886/instruments-tutorial-with-swift-getting-started) tutorial. And I'm still a bit confused to your answer and to which I should use to find memory leaks or I should ues both? Using Allocations, won't I be able to find out leaks by seeing objects **persist**?...The tutorial also says *The Allocations track will be discussed in detail later on; the Leaks track is generally more useful in Objective-C, and won’t be covered in this tutorial.* which confuses me more, since I'm working with Swift. – mfaani Nov 16 '16 at 15:57
  • I always use both tools to get a better understanding of my memory management and possible problems. No matter if obj-c or swift code. – Volker Nov 17 '16 at 09:00
1

Thanks to Rob pointing out in the comments of this question I found this WWDC 2012: iOS App performance: Memory; Minute 30. Make sure you see the question in full and the WWDC video.

In a nutshell, memory growth can happen for 3 reasons:

enter image description here

Allocations is a much broader term.

  • Leaks can be like leaks with closures, delegates which have reference cycles. Both Allocations and Leaks would help you identify this.
  • Abandon memory "is due to strong pointers from a persistent object that won’t get released while our app is running". Like a class which has a timer being strongly pointed by RunLoop, or a DispatchSourceTimer being strongly pointed by GCD, etc. For more see here. Allocations will help you identify this. Leaks can't detect this.
  • Cached memory: This is an interesting case. It's not a programming error. Simply put it's just a mistake. Suppose you cache images that aren't really needed, e.g. you cache all photos of last year, while 90% of the users care about photos of last month only. Allocations will help you visualize the memory growth. Leaks won't. Because it's not a leak. Technically you could write an app with 0 leaks, but one that caches everything and consumes 10 gigabytes. Users will hate you for that!

You really need to understand that:

Strong reference cycle (a.k.a. leaks) warning is produced when there are two (or more objects) whose only strong references are between each other. Abandoned memory or cached memory is neither of them!

mfaani
  • 33,269
  • 19
  • 164
  • 293
  • Too often extraneous caching is the culprit, but engineers tend to think of more complicated ways that causes them memory issues – mfaani Mar 11 '22 at 16:46