When I do this:
barplot(c(1,2,3),ylim=c(4,1))
I expect the first bar in the barplot to go from 4 to 1. The second bar should go from 4 to 2 and so on. But that's not what I get. How can I achieve this?
When I do this:
barplot(c(1,2,3),ylim=c(4,1))
I expect the first bar in the barplot to go from 4 to 1. The second bar should go from 4 to 2 and so on. But that's not what I get. How can I achieve this?
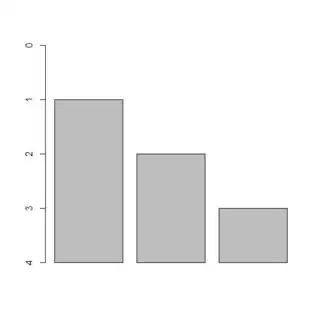
It sounds like you probably want barplot(c(1,2,3),ylim=c(4,0)), which yields:
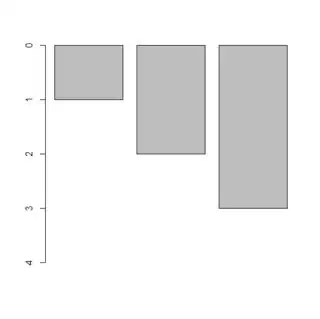
But it also sounds like you might be asking for (the somewhat confusing) barplot below:
barplot(c(3,2,1),ylim=c(0,4), yaxt='n')
axis(2, 0:4, 4:0)
In the spirit of Thomas' code, you also might want this:
barplot(4 - c(1,2,3),ylim=c(4,0), yaxt='n')
axis(2, 0:4, 4:0)