I have a question regarding the use of ggplot. I have the following data.frame, and a constant. I'm using the following function and I managed to make my plot but I can not print the legend, what am I doing wrong?
this function would I use to get the plot:
LINER_GRAPH_POWER_LIST_VALUES<-function(DF_N_EPC_AND_FOUND_EPC, DF_READ_EXTERNAL_LIST_EPC_TAGS ){
  require(ggplot2)
  ggplot(DF_N_EPC_AND_FOUND_EPC, aes(x=power_value, y=total_epc), colour = variables) +
  geom_line(color="red") +
  geom_point(color="red", shape=20) +
  geom_line(aes(x=power_value, y=found_epc), color="blue") +
  geom_point(aes(x=power_value, y=found_epc), color="blue", shape=20) +
  geom_hline(yintercept=nrow(DF_READ_EXTERNAL_LIST_EPC_TAGS), color="green")+
  scale_colour_manual(values = c("total_epc"="red","epc_found"="blue", "num_of_list_reference_tags"="green"))
}
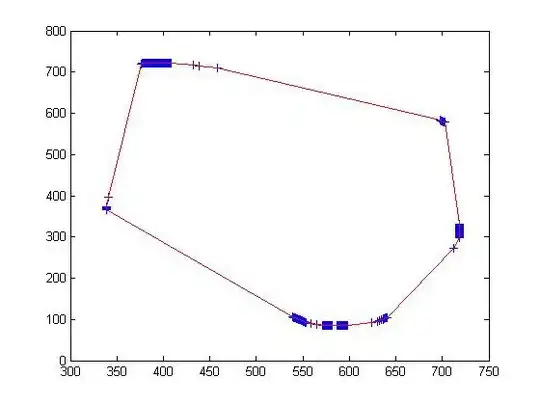
the plot

And the data.frame -> DF_N_EPC_AND_FOUND_EPC
    power_value total_epc   found_epc
1   31.5    9   5
2   31.0    7   4
3   30.5    6   4
4   30.0    7   4
5   29.5    8   5
6   29.0    9   5
7   28.5    8   5
8   28.0    9   5
9   27.5    8   4
10  27.0    7   4
11  26.5    8   5
12  26.0    7   5
13  25.5    5   4
14  25.0    5   4
15  24.5    5   4
16  24.0    4   3
17  23.5    4   3
18  23.0    4   3
19  22.5    4   3
20  22.0    4   3
I'm using scale_colour_manual, as you can see, but the legend of the graph does not appear