18

Let's say someone wrote a method like this in a file called app.js trying to peform an XHR request angainst a non existing url:

app.controller('MainCtrl', function($scope,$http) {
  $scope.send = function() {
    $http.get('http://run.plnkr.co/thisIs404');
  };
});

I can see an error regarding URL http://run.plnkr.co/thisis404 in console and network panel :

error in console

To debug this I want to find quickly where this XHR call was made in sources (ie find the app.js file) :

So I enable in chrome dev tools :

  • async debug in call stack
  • debug any XHR

Debugger actually stops on XHR request, but the call stack only displays references to angular.js "core" files : no reference to app.js anywhere to be found.

google chrome call stack

I tried this with chromium 36 and chrome 35. Only solution : search for the wrong URL in the whole code base (which in some case may be hard to do).

  • Isn't the async debug mode supposed to point to app.js somwhere in the stack ?
  • Is there a way to track down this app.js file easily from the console error ?

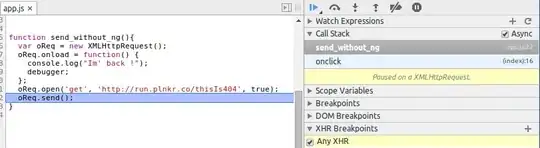
With vanilla XHR requests (ie without angular), XHR debug call stack displays the XHR call in app.js (which is easier to debug in this case) :

enter image description here

Full example here : http://plnkr.co/edit/lnCRpv?p=preview

[EDIT] As i've been asked : Angular.js is not minified in my tests.

sylvain
  • 1,951
  • 2
  • 19
  • 34

3 Answers3

11

So, you see, this issue is mostly because angular's $http sucks. Sorry about that.

Let's try to use the bluebird library, because it provides long stack traces.

Promise.longStackTraces();
Promise.resolve($http.get('...'));

You get the following stack trace:

Possibly unhandled Error: [object Object]
    at Promise$_rejectFromThenable (http://cdn.jsdelivr.net/bluebird/1.2.4/bluebird.js:4736:52)
    at wrappedErrback (https://code.angularjs.org/1.3.0-beta.5/angular.js:11334:78)
    at wrappedErrback (https://code.angularjs.org/1.3.0-beta.5/angular.js:11334:78)
    at wrappedErrback (https://code.angularjs.org/1.3.0-beta.5/angular.js:11334:78)
    at https://code.angularjs.org/1.3.0-beta.5/angular.js:11467:76
    at Scope.$eval (https://code.angularjs.org/1.3.0-beta.5/angular.js:12418:28)
    at Scope.$digest (https://code.angularjs.org/1.3.0-beta.5/angular.js:12230:31)
    at Scope.$apply (https://code.angularjs.org/1.3.0-beta.5/angular.js:12522:24)
    at done (https://code.angularjs.org/1.3.0-beta.5/angular.js:8207:45)
    at completeRequest (https://code.angularjs.org/1.3.0-beta.5/angular.js:8412:7) 

(Plunker here.)

The most important line is the first: Possibly unhandled Error: [object Object].

Yep. An object is thrown, not a real Error object, with the stack property attached to it. For the reference, here is how to throw an error and keep its stack along with it: https://github.com/Ralt/newerror/blob/master/index.js

So, how to fix this? It depends on several decisions:

  • Do you want to add a proper Promise lib that enables long stack traces?
  • Do you want to use another xhr lib that throws correct errors?

If you want to add a real Promise lib, use bluebird. AFAIK, it is one of the few that provides long stack traces, and it is the fastest one out there.

For a proper xhr lib that throws real errors, I'm afraid you're out of luck there. Writing a custom one with the support for browsers you want isn't really hard though. With no IE8 support, this works (with bluebird):

function xhr(url) {
    return new Promise(function(resolve, reject) {
        var xhr = new XMLHttpRequest();
        xhr.onload = function() {
            resolve(xhr.responseText);
        };
        xhr.onerror = reject;
        xhr.open('GET', url);
        xhr.send();
    });
}

(Plunker here.)

As you can see, the stack trace is informative:

correct stack trace

Florian Margaine
  • 58,730
  • 15
  • 91
  • 116
  • 2
    Yes, this answer is correct - this is because Bluebird does unhandled rejection tracking and Angular does not - see [**This question**](http://stackoverflow.com/questions/23984471/how-do-i-use-bluebird-with-angular) on how to use bluebird with AngularJS. AngularJS promises have very bad stack traces that make working with them in real world scenarios really hard. – Benjamin Gruenbaum Jun 23 '14 at 15:20
  • Can we modify angular's http function to use bluebird, so that it can work without modifcation of existing projects? What about the following: http://plnkr.co/edit/1boCEqUjSLx8zGX2uqSo – David Sep 20 '15 at 09:24
1

XHR requests are stacked in $http.pendingRequests array and are send later. Which is why you can't find a direct linked between where $http is called and where the actual XHR request is made.

If you want to know which function called $http you have to set a breakpoint in $http function.

It kinds of defeat the whole "XHR breakpoints" purpose in my opinion.

sylvain
  • 1,951
  • 2
  • 19
  • 34
0

One option that came in my mind is to create a module for $http debugging that you can add it as a dependency in your main module whenever you need to debug $http calls. There a decorator for the $http service can be registered that will simply log the arguments of the call a forward it to the $http service. There a breakpoint can be set too.

I have created a simple working example here. I hope it will help.

Example $http logger decorator implementation:

var httpDebugging = angular.module('http-debugging', []);

httpDebugging.decorator('$http', function ($delegate) {
  var debugAware = function (fnCallback) {
    return function () {
        var result = fnCallback.apply(this, arguments);    
        console.log('$http decorator: ', arguments);
        return result;
    };   
  }; 

  for(var prop in $delegate) {
    if (angular.isFunction($delegate[prop])) {
        $delegate[prop] = debugAware($delegate[prop]);
    }
  }

  return $delegate;
});
S.Klechkovski
  • 4,005
  • 16
  • 27
  • Hi, this gives the information with $http was called with, which is helpful, but placing a breakpoint on the $http function achieves the same. Is it possible to extract the caller (and preferrably, line no, that started the $http request? – David Sep 20 '15 at 12:32
  • Yes, buy adding a breakpoint on the console.log() statement you can see the function from where the call was made as first on the javascript callstack. – S.Klechkovski Sep 20 '15 at 12:37
  • Awesome. I'll update it to include the whole callstack using http://www.stacktracejs.com/ – David Sep 20 '15 at 13:01
  • what about the 404 ajax requests? can you get the line of code that caused it ? – v0d1ch May 15 '16 at 14:21
  • Probably yes, by combining the $http decorator with an interceptor. In the interceptor you will have the response code. – S.Klechkovski May 15 '16 at 14:47