6

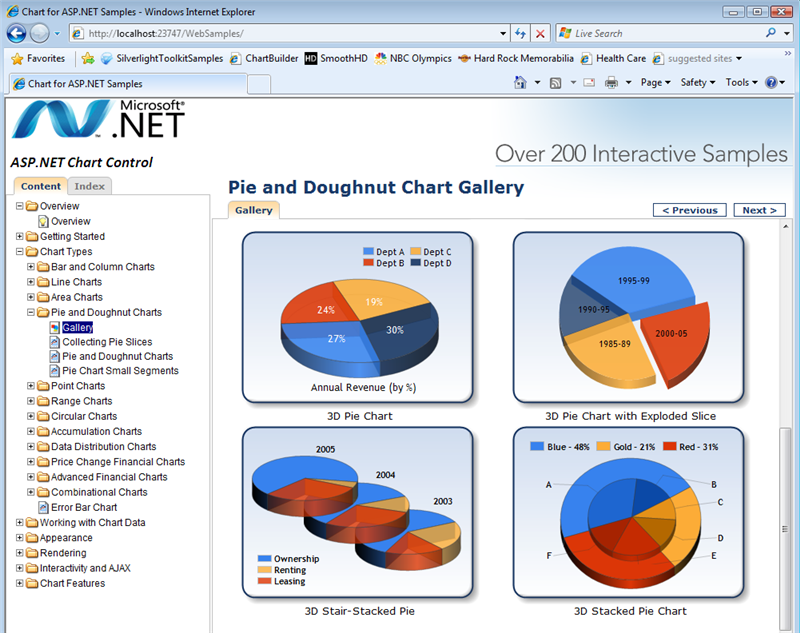
I'm working with the ASP.NET Charting Library and I've got it generating a pie chart but I'm having a problem configuring it to generate the pie chart with semi-transparent slices. If you look at the image you'll see what I'm talking about. Of the 4 pie charts the top 2 and the bottom left chart have the pie slice transparency I'm talking about.

Charting Control Image
(source: scottgu.com)

What settings of the chart do I tweak to render the slices with a certain % of transparency?

Thanks!

Glorfindel
  • 21,988
  • 13
  • 81
  • 109
Ryan
  • 6,756
  • 13
  • 49
  • 68

4 Answers4

8

Try assigning the color of the series to a color with alpha transparency, like so:

Chart1.Series(0).Color = Color.FromArgb(128, 255, 0, 0) //transparent red

Taken from this thread.

Matthew Jones
  • 25,644
  • 17
  • 102
  • 155
1

This the ultimate solution for both cases - one color per series or palette charts:

myChart.ApplyPaletteColors();

foreach (var series in myChart.Series)
{
    foreach (var point in series.Points)
    {
        point.Color = Color.FromArgb(220, point.Color);
    }
}
Oleg Sakharov
  • 1,127
  • 2
  • 20
  • 19
0

Try this:

Series["SeriesName"].Color = Color.FromArgb(180, Color.Blue);

Where 180 defines the "transparency level", which must be between 0 to 255.

You can use semi transparent palettes.

Refer to:

https://blogs.msdn.microsoft.com/alexgor/2009/10/06/setting-microsoft-chart-series-colors/

Andrew
  • 7,602
  • 2
  • 34
  • 42
0

Solution for color per serie and even for transparent palette:

Chart1.Series(0).Color = Color.FromArgb(200, Chart1.Series(0).Color)