45

I wonder if there is a good way to find the source code that causes a heap corruption error, given the memory address of the data that was written 'outside' the allocated heap block in Visual Studio;

Dedicated (0008) free list element 26F7F670 is wrong size (dead)

(Trying to write down some notes on how to find memory errors)

genpfault
  • 51,148
  • 11
  • 85
  • 139
Danne
  • 451
  • 1
  • 5
  • 3

9 Answers9

77

Begin with installing windbg:

http://www.microsoft.com/whdc/Devtools/Debugging/default.mspx

Then turn on the pageheap like this:

gflags.exe /p /enable yourexecutable.exe /full

This will insert a non writable page after each heap allocation.

After this launch the executable from inside windbg, any writes outside the heap will now be caught by this debugger. To turn of the pageheap afterwards use this:

gflags.exe /p /disable yourexecutable.exe

More info on how to use the pageheap here.

Evandro Coan
  • 8,560
  • 11
  • 83
  • 144
Andreas Brinck
  • 51,293
  • 14
  • 84
  • 114
  • 7
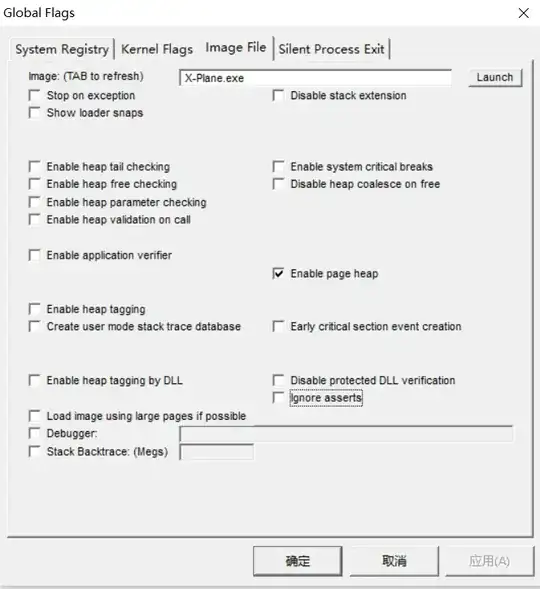
    Best solution! Saved my life. Also, directly open gflags.exe and using GUI works too. Go to "Image File", fill in the exe file name, and check "Enable page heap". Any debugger will work. – leoly Feb 27 '15 at 12:08
  • 3
    Thanks a lot. It take me two days before I found out this technique. I just check "Enable page heap" and use visual studio debugger as normally. And then, it will break exactly at the code position causing the heap corruption bug. My bug is due to one thread is continuously feeding data, while other thread allocate only memory enough for old data, which is not enough for storing new data. – khanhhh89 Mar 23 '16 at 02:13
  • I am trying to install this debugging tools, but it is asking me to uninstall latest SDK. Please suggest – Kinjan Bhavsar Aug 31 '16 at 04:53
  • In my case it doesn't help. Turning this flag on makes program working (tested many times). Once the flag is turned off, the program crashes with heap corruption error. – mistika Nov 01 '16 at 21:44
  • for me, it's `/p` not `-p`. It didn't recognize `-p`. – TankorSmash Jan 13 '17 at 04:50
  • No luck here either sadly,. program still crashes, but it's always in winnt.dll or some similar generic windows dll. – T.S Nov 16 '17 at 15:59
  • 6
    Be very careful using this!!! I had a situation where I set all gflags, but forgot to disable them afterwards. It took me an entire week to figure out that those flags were causing a next problem. – Dominique Oct 26 '18 at 08:18
  • 1
    Was debuging my code, but third party dll had issues - so instead of using '/full' I used '/dll DLL[**,DLL]` and only selected my dlls. – Robert Andrzejuk Oct 22 '19 at 11:40
  • For me, OS restart is required to disable this. – Alexander Dyagilev Jul 19 '23 at 17:47
12

For Window 10 you could enable the PageHeap option in the GFlags Tool, this tool is included as part of the Debugging Tools for Windows.

The Page Heap options in GFlags lets you select standard heap verification or full-page heap verification. Beware, the full heap verification uses a full page of memory for each allocation so it can cause system memory shortages.

To enable the Page Heap in GFlags:

•To enable standard page heap verification, the standard version will write a pattern at the end of each heap allocation and then examine the pattern when the allocations are freed.

To verify all processes use:

gflags /r +hpa

gflags /k +hpa

for a single process use:

gflags /p /enable ImageFileName

•To enable full page heap verification for one process, this option places an inaccessible page at the end of each allocation so that the program stops immediately if it tries to accesses memory beyond the allocation, this should only be used on a single process due to the heavy memory consumption.

gflags /i ImageFileName +hpa

gflags /p /enable ImageFileName /full

The two commands above are interchangeable.

Note: All page heap settings mentioned above are system wide settings stored in the registry (except /k) and remain effective until you change them. The /k setting is a Kernel flag setting are set for this session and will be lost when Windows shuts down

Another helpful tool is the Application Verifier, but this is not part of the Debugging Tools for Windows, rather it is included in the Windows Software Development Kit (SDK).
Merav Kochavi
  • 4,223
  • 2
  • 32
  • 37
5

Maybe you can try Microsoft's Application Verifier. It solved a similar problem for me once,by turning on extra checks on heap operations. In my opinion, the randomness of corrupted address is because the heap can be 'subtly' damaged, and the problem won't show up until something big happens to the heap (like massive allocation/free).

Smithy
  • 111
  • 4
2

more info about Gflags and PageHeap(which helped a lot): http://msdn.microsoft.com/en-us/library/windows/hardware/ff549561%28v=vs.85%29.aspx

NoAngel
  • 1,072
  • 2
  • 18
  • 27
2

You could set a breakpoint on a write to the memory address. The debugger will then show you the code that writes to the location, but you still need to work out which of the writes are causing the problem.

Timo Geusch
  • 24,095
  • 5
  • 52
  • 70
2

It's probably too late but if it compiles with gcc and can run on linux you may use valgrind to find the source of the problem (i don't remember the flags, i only used it once with great success).

  • Good luck with that, microsoft have gone to great length to make sure that their string processing commands are incompatible with as many standards as they can. If it's very simple though, you might get away with it. – Owl Oct 10 '17 at 13:37
1

I am assuming C++ as the language.

If the error is reproducible and the corrupted address is always the same, you can put a data breakpoint to stop the program when writing at this address.

Timores
  • 14,439
  • 3
  • 46
  • 46
  • 1
    Language is C/C++ mixed. The corrupted address is different at each debug session so I guess it's not possible to use a data breakpoint – Danne Mar 18 '10 at 13:49
  • 1
    You're unfortunately right. In these cases, my approach is to #define free/delete to be nothing. If the problem disappears, I #define malloc/new/free/delete to a function that logs each call, in order to find duplicate deletes or deletes without an allocation. – Timores Mar 19 '10 at 07:51
1

Make sure all libraries you are linking to are compiled in the same CLR version as the application you are running - all in Release or all in Debug.

When you compile in either Debug and Release you are actually targeting two different versions of the C runtime library. These versions are quite different and they use different strategies for allocating memory and they use different heaps. But the most important thing to know is that they are NOT compatible with one another.

The Release C runtime library allocated memory as expected, whereas the Debug will add extra information, such as guard blocks to track buffer overflow and the location that called the allocation function, and in turn it allocates more memory than the Release.

If your are linking your application to a mix of DLLs which were built in Release and Debug, you will most likely end up trying to delete an object in one CLR which was created in another. This means you will be trying to free more or less memory than what was allocated to the object and this can corrupt the heap.

You should build your application, as well as attach to libraries which are built under the same configuration, either Release or Debug.

This problem can occur especially in modules that are being compiled with different compilers.

There is a way to work around, which I will mention but do not recommend. If for some reason you still need to build in different modes, this work around will allows for all memory to be allocated and freed from the same shared heap. The API GetProcessHeap will allow you to access the shared heap throughout the different modules. By using the HeapAlloc & HeapFree you can allocate and free memory in the shared heap. Note: the HeapAlloc and HeapFree should replace all calls to malloc and free in your application.

Merav Kochavi
  • 4,223
  • 2
  • 32
  • 37
  • I compile against the same version of a 3d party libraries (for example OpenCV ) in both my Debug and Release. As far as I can tell this only means that in debug I can't step into any of the 3d party code and that it also runs a bit faster in debug. Am I wrong do you think? – ILIA BROUDNO Aug 22 '17 at 00:46
  • @ILIABROUDNO Usually 3rd party libraries being distributed will distribute a release library that others can use in either release or debug mode. They do this by building their DLLs to includes their copy of the C runtime library, along with this, they make sure not share CRT resources such as the heap across library boundaries in order to to assure that dynamically allocated memory will be deallocated on the same side of the boundary. In conclusion, if the 3rd party libraries you are linking to have done so, you should have no problem using them in Release as well as Debug. – Merav Kochavi Aug 22 '17 at 06:41
  • @ILIABROUDNO if this was helpful, please +1 :) – Merav Kochavi Aug 22 '17 at 06:43
0

it saved my life, I am debugging X-Plane 12 heap corruption, which has taken me a week for no progress.

gflags.exe is located at C:\Program Files\Debugging Tools for Windows (x64)\gflags.exe

and it must be run as administrator, then GUI image input use X-Plane.exe, don't use the path of X-Plane.exe.

Then click "Enable Page Heap", and finally apply. But "Enable Page Heap" is too strong for your cases, because it eats up huge memory

OK, then you can launch X-Plane 12 as usual, but you will find X-Plane launch time is much much longer than before, which is not the case for debug purpose

Global Flags

cpuwolf
  • 27
  • 3