0

I'm plotting multiple data series.

colos=c('red','green','purple','pink','brown')
par(new=F)
for (i in 1:5)
{
  plot(dat[[i+1]],col=colos[i],cex=marksize,xlab='Reading #',ylab = 'Current')
  par(new=T)
}

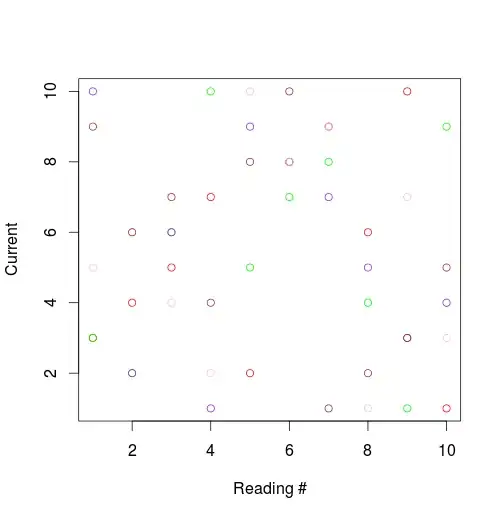
My plot looks like this:R plot with bad axis labeling

Is there a way I can overwrite the plot axis with each iteration, but not overwrite the plotted points?

kilojoules
  • 9,768
  • 18
  • 77
  • 149

2 Answers2

2

You may want to use the lines or points function(s) instead. Here's an example of how I usually go about this problem. This way you only overlay points on top of the existing plot, instead of plotting one plot on top of another.

Plot the first one with your original plot call, then use lapply to overlay the other columns' points on top of that.

set.seed(1)
dat <- data.frame(replicate(5, sample(10)))
colos <- c('red','green','purple','pink','brown')
plot(dat[[1]], col = colos[1], xlab = 'Reading #',   
     ylab = 'Current', ylim = range(as.matrix(dat)))
invisible(lapply(2:ncol(dat), function(i) points(dat[[i]], col = colos[i])))

enter image description here

Rich Scriven
  • 97,041
  • 11
  • 181
  • 245
  • This solution did not work for me. I need to rescale my y axis after every new data set is added. – kilojoules Oct 25 '14 at 21:35
  • In the original `plot` call, try setting `ylim = range(as.matrix(dat))` and that should fix it. Also, I'm not sure about transparent points yet. I need to research that (can't remember). – Rich Scriven Oct 25 '14 at 21:38
2

Turn off the axes using xaxt and yaxt

E.g.:

plot(1:10)
par(new=TRUE)
plot(1:10, rnorm(10), xaxt="n", yaxt="n", xlab="", ylab="", type="l")
axis(side=4)

enter image description here

rbatt
  • 4,677
  • 4
  • 23
  • 41