6

Got a chart control i wanna make from a data table.

the table looks like this:

alt text http://www.freeimagehosting.net/uploads/5d02ce1558.png

the chart i want will look like this:

''' 
''''
'''''       '' '  
'''''       '' '
ECCTMP      ECCTMP       ECCTMP   
Monday      Tuesday      Wednesday

hope this makes sense for each day its grouped b y the type (email, calls).

I'm just now sure how to databind it?

Billy

iamjonesy
  • 24,732
  • 40
  • 139
  • 206

2 Answers2

5

If you're looking to group series in a bar chart then you'll need to use the Chart.DataBindTable method (MSDN).

Just add the following code:

Chart1.DataBindTable(IEtable, "Day");

This will produce a chart that looks something like the following: alt text
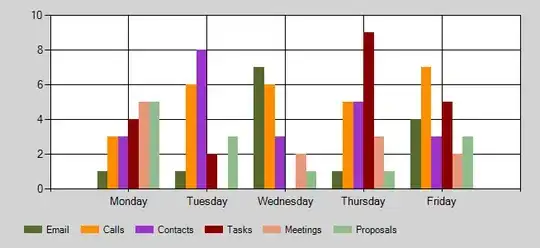
Here's some dummy code to use as a test:

DataTable table = new DataTable();
table.Columns.Add("Day", typeof(string));
table.Columns.Add("Email", typeof(int));
table.Columns.Add("Calls", typeof(int));
table.Columns.Add("Contacts", typeof(int));
table.Columns.Add("Tasks", typeof(int));
table.Columns.Add("Meetings", typeof(int));
table.Columns.Add("Proposals", typeof(int));

table.Rows.Add("Monday", 1, 3, 3, 4, 5, 5);
table.Rows.Add("Tuesday", 1,6,8,2,0,3);
table.Rows.Add("Wednesday", 7, 6,3,0,2,1);
table.Rows.Add("Thursday", 1,5,5,9,3,1);
table.Rows.Add("Friday", 4,7,3,5,2,3);

//convert datatable to a IEnumerable form
var IEtable = (table as System.ComponentModel.IListSource).GetList();

//Bind the datatable to the chart using the DataBindTable method
Chart1.DataBindTable(IEtable, "Day");

It is also possible to have the labels appear as you describe with ECCTMP but adding a legend will probably look cleaner.

NakedBrunch
  • 48,713
  • 13
  • 73
  • 98
  • This code looks brilliant thanks, can't wait to try it. I'll let you know how I get on! – iamjonesy Aug 20 '10 at 10:02
  • 1
    Glad to hear it is working out for you. It is also possible to change the labels as you wrote in your question so that they appear as "ECCTMP Monday" but I assumed that the Legend would work just as well for you. – NakedBrunch Aug 20 '10 at 12:21
  • @Alison, It's column chart right, If I want same in Bar chart then how will I do it ? I tried same code but it throws an error "Chart Area Axes - The chart area contains incompatible chart types. For example, bar charts and column charts cannot exist in the same chart area." I believe something missing in mark up. – Ris Mar 21 '13 at 17:56
  • @Rishi: I can't change/update the answer here but post a new question and I can answer that one for you. – NakedBrunch Mar 21 '13 at 18:39
  • @Alison, Thanks for your reply. I already posted the question. Here is the link, http://stackoverflow.com/questions/15553875/multi-series-bar-chart-in-net-chart-control – Ris Mar 21 '13 at 18:43
0
protected void Page_Load(object sender, EventArgs e)
    {

        Title tl = new Title("Players Score Card");
        tl.Font = new System.Drawing.Font("vardana",12);
        //chrtGroup.Titles.Add(tl);
        //ChartArea a = new ChartArea("players");
        //a.AxisX.Title = "Player's Yearwise";
        //a.AxisY.Title = "Scores";
        //chrtGroup.ChartAreas.Add(a);


        DataTable dt = new DataTable();
        dt.Columns.Add("Years", typeof(int));
        dt.Columns.Add("Afridi", typeof(int));
        dt.Columns.Add("Akmal", typeof(int));
        dt.Columns.Add("Nasir", typeof(int));
        dt.Columns.Add("Shoib",typeof(int));
        dt.Columns.Add("Hafiz", typeof(int));


        Random rn = new Random();
        for (int i = 1; i < 10; i++)
        {
            DataRow dr = dt.NewRow();
            dr["Years"] = "200" +i;
            dr["Afridi"] = 700 + rn.Next(200,800);
            dr["Akmal"] = 500 + rn.Next(200,800);
            dr["Nasir"] = 400 + rn.Next(200,800);
            dr["Shoib"] = 800 + rn.Next(300,500);
            dr["Hafiz"] = 200 + rn.Next(200, 900);
            dt.Rows.Add(dr);
        }

        Series afridi = new Series("Afridi");
        Series akmal = new Series("Akmal");
        Series nasir = new Series("Nasir");
        Series shoib = new Series("Shoib");
        Series hafiz = new Series("Hafiz");

        afridi.IsValueShownAsLabel = true;
        akmal.IsValueShownAsLabel = true;
        nasir.IsValueShownAsLabel = true;
        shoib.IsValueShownAsLabel = true;
        hafiz.IsValueShownAsLabel = true;

        foreach (DataRow r in dt.Rows)
        {
            afridi.Points.AddXY(Convert.ToDouble(r["Years"]),Convert.ToDouble(r["Afridi"]));
            akmal.Points.AddXY(Convert.ToDouble(r["Years"]), Convert.ToDouble(r["Akmal"]));
            nasir.Points.AddXY(Convert.ToDouble(r["Years"]),Convert.ToDouble(r["Nasir"]));
            shoib.Points.AddXY(Convert.ToDouble(r["Years"]), Convert.ToDouble(r["Shoib"]));
            hafiz.Points.AddXY(Convert.ToDouble(r["Years"]), Convert.ToDouble(r["Hafiz"]));
        }

        chrtGroup.Series.Add(afridi);
        chrtGroup.Series.Add(akmal);
        chrtGroup.Series.Add(nasir);
        chrtGroup.Series.Add(shoib);
        chrtGroup.Series.Add(hafiz);

        chrtGroup.Legends.Add(new Legend("Afridi"));
        chrtGroup.Legends.Add(new Legend("Akmal"));
        chrtGroup.Legends.Add(new Legend("Nasir"));
        chrtGroup.Legends.Add(new Legend("Shoib"));
        chrtGroup.Legends.Add(new Legend("Hafiz"));
    }
}
Fuzzybear
  • 1,388
  • 2
  • 25
  • 42