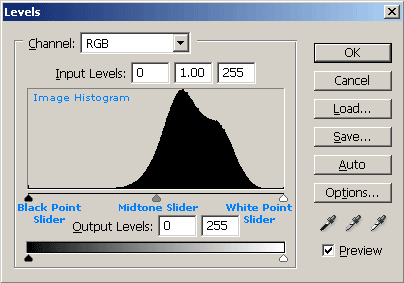
I think this is a function mapping input levels to output levels as shown below in the figure.
For example, the orange curve is a straight line from (a, c) to (b, d), blue curve is a straight line from (a, d) to (b, c) and green curve is a non-linear function from (a,c) to (b, d).
We can define the blue curve as (x - a)/(y - d) = (a - b)/(d - c).
Limiting values of a, b, c and d depend on the range supported by the channel that you are applying this transformation to. For gray scale this is [0, 255].
For example, if you want a transformation like (a, d) = (10, 200), (b, c) = (250, 50) for a gray scale image,
y = -150*(x-10)/240 + 200 for x [10, 250]
y = x for [0, 10) and (250, 255] if you want remaining values unchanged.
You can use a lookup table in OpenCV (LUT function) to calculate the output levels and apply this transformation to your image or the specific channel. You can apply any piecewise transformation this way.