142

I'm trying to figure out why something with Javascript isn't working inside of a UIWebView. To my knowledge, there is no way to set a breakpoint inside of XCode for a js file. No problemo, I'll just go back to 2004 and use alert statemen-- oh wait they don't seem to work inside of a UIWebView either!

The only thing I could think of is by exporting my HTML And JS files to my desktop and then just doing my debugging inside of Safari. And that works! But of course, the bug I'm fighting with in the UIWebView doesn't occur in Safari.

Are there any other ways for debugging inside of a UIWebView, or any tricks that I can use akin to using the old-school alert method?
bpapa
  • 21,409
  • 25
  • 99
  • 147

8 Answers8

289

If you're using iOS >= 6 and you have mountain lion (10.8) or Safari >= 6, you can just:

  1. Open the application in the simulator (or your device in XCode >= 4.5.x).
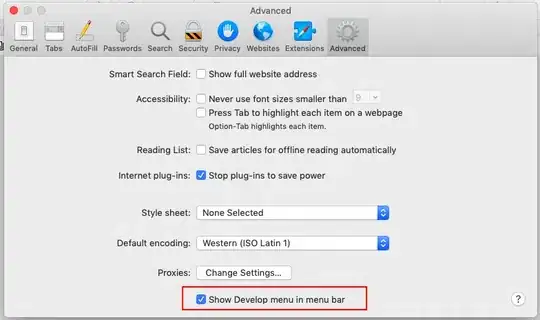
  2. Open Safari (go to Preferences -> Advanced and make sure "Show Develop Menu in Menubar" is on.
  3. From the Menu-bar (of Safari) select Develop -> iPhone Simulator -> [your webview page].

That's it !

refaelos
  • 7,927
  • 7
  • 36
  • 55
  • 6
    This only works if are running the app in a simulator. If you must use an iOS device for debugging, see this approach http://mobiarch.wordpress.com/2013/04/06/javascript-console-log-from-a-uiwebview/ – RajV Apr 06 '13 at 14:48
  • 7
    @RajV You can debug UIWebViews on a physical device but only the ones you put directly with XCode on your device, not the ones from the Appstore. – alecail Jun 09 '13 at 13:02
  • 1
    Pretty obvious, but this may be helpful. I've tested this on iOS7 Simulator running OSX 10.9 Mavericks and Safari 7 - working beautifully. Thanks for this. – Moe Nov 21 '13 at 12:25
  • @refaelos, I followed the above steps, and started recording and clicked on iOS simulator webview, but safari debugger is completely blank. (I mean its not showing any graph of any request response OR any values getting updated). – JiteshW Mar 10 '15 at 11:57
  • @refaelos I'm using iOS8 and Yosemite, but after I open my application from Xcode, my safari develop menu doesn't show my simulator... – xi.lin Mar 28 '15 at 14:09
  • 1
    @refaelos Thanks!! Its evn working with my physical device if I use Development provisional profile. – umang2203 Apr 02 '15 at 13:31
  • @xi.lin I'm not sure what you're doing wrong. The Develop menu should show all webviews presented in the simulator. – refaelos Apr 03 '15 at 09:08
  • @refaelos it's really strange that after I reboot Mac and it shows up in the menu. But this happens frequently and I have to reboot each time. Is it because I'm using reveal at the same time? – xi.lin Apr 03 '15 at 18:13
  • @alecail Do you mean developer or distribution provisioning profile? It doesn't work for me on physical device. – DawnSong Jun 16 '15 at 02:38
  • It should work on device as well. Not sure it matters what provisioning profile you're using. – refaelos Jun 16 '15 at 07:12
  • 11
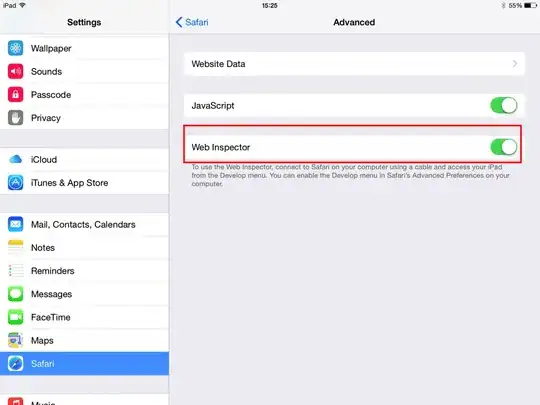
    Not sure about on the simulator but to get this working on a device there's an option you have to enable in the settings. `Settings` > `Safari` > `Advanced` > `Web Inspector` <-- enable this – Hodson Jun 17 '15 at 12:57
  • Is there any way to set safari inspector to auto open when you re-run the app? – newshorts Aug 13 '15 at 16:48
  • 1
    @newshorts no. I couldn't find such option. – refaelos Oct 16 '16 at 15:17
  • do restart the safari browser after the emulator started, otherwise, you will not able to see the emulator inside the developer option – inyee Jun 28 '21 at 08:00
31

This query tops google, so worth linking to the remoteInspector hidden in iOS5 - by far the best way found so far to debug your UIWebViews - just conditional compile out before you send to Apple.

Dan Bennett
  • 1,450
  • 1
  • 15
  • 17
  • 3
    Does still work, use it like this: `[NSClassFromString(@"WebView") performSelector:@selector(_enableRemoteInspector)];` Remember to remove the call when you build for release! – rpitting Apr 03 '12 at 13:58
  • 1
    It's a great technique. However, note that the debugger seems to only work in safari. I tried it from other browsers (chrome for example) and it showed nothing. – Sagi Mann Jul 31 '12 at 11:05
  • 3
    I used to use this before, but apparently it's not working now since Mountain Lion showed up (possible workaround here): http://www.iwebinspector.com/help.html#ml – Omer Aug 14 '12 at 16:46
10

I get the awesome way to debug UIWebView Or SFSafariViewController.

I hope It will Help.

Step 1: 
 Open Safari VC In Your Mac (hahaha Don't make your face, If I am saying in your Macbook just follow this my steps)


Step2: Go at Safari preferences And Click on Advance. 

You will Get this setting on your MacBook Screen.

enter image description here

Now enable the Show to develop menu in menu bar.

 Now Your All work is done. 

Are you thinking I am kidding :P :P no man... 


Step3: Run your application in Device or Simulator. (Don’t Think Just run )
And go in your application where you are opening your Webview or SFSafariViewController. 
 Till now you did not understand I know. Be cool and see my next step.

Step4: Open Safari In your MacBook and Click on Develop Option from the Menu bar. 

Did you get something your MacBook, iPad/ iPhone is Displaying Right?????

enter image description here


Step5: Its Done. click your device and click on URL New popup will come out like This. enter image description here


Step6: what are you looking now its over here all the steps.

Now debug your Webpage on this console. Be happy and enjoy your day while doing coding With a cup of tea or Coffee.

IMP: Don't forget to enable See Below Image enter image description here 


Anup Gupta
  • 1,993
  • 2
  • 25
  • 40
9

alert() certainly works for me.

However, you can also do lots of other things, like make your own DHTML alert that pops up in a layer. This can be nice because you can do multiple alerts to a single div, without stopping your app. You should also be able to write a stack trace to it (the stack trace is in the exception object, and you can always throw your own exceptions).

Alternatively, if running on the simulator your custom "alert()" could call into objective C, and display the string in the iPhone simulator's console window:

document.location.href = "http://debugger/" + 
   encodeURIComponent(outputString);   

and on the objective C side:

//--------------------------------------------------------------------
- (BOOL)webView:(UIWebView*)webView 
       shouldStartLoadWithRequest: (NSURLRequest*)req 
       navigationType:(UIWebViewNavigationType)navigationType {
    if ([[[req URL] host] isEqualToString:@"debugger"]){
        // do stuff with [[req URL] path] 
       }
}

That said, I have an app that is heavy on the UiWebView / javascript stuff, and I tend to do most javascript dev in Chrome (simulating what is necessary from the iPhone environment)

rob
  • 9,933
  • 7
  • 42
  • 73
  • what do you mean "alert()" certainly works for me? Doing a call into Objective-C is creative, surprised I didn't think about that before since I do a bit of it already! Thanks. :) – bpapa May 21 '10 at 00:17
  • Yes, alert() works just fine. Maybe it didn't on an older version? But I just tried it, and get a popup that looks nearly identical to one done with UIAlertView on the objC side. – rob May 21 '10 at 01:37
6

I haven't tried this yet, but take a look at this Weinre

Looks very promising.

reevesy
  • 3,452
  • 1
  • 26
  • 23
Adrian Harris Crowne
  • 1,335
  • 2
  • 12
  • 11
  • weinre is cool, but beware that it doesn't come with a stepwise JS debugger; it's just a "web inspector." (I didn't notice this until I'd gone to a lot of trouble getting it set up on my iPhone.) – Dan Fabulich May 01 '11 at 03:50
  • Weinre seems to have stopped working since Lion: I cannot get connections anymore, possibly an issue with sandboxing. – rpitting Apr 03 '12 at 13:39
  • It seems that Adobe has a deal with Weinre now and offers an app called Adobe Shadow which implements it. Works pretty well. – Adrian Harris Crowne Jul 27 '12 at 18:43
  • I installed weinre through npm (node.js package manager) and it is working for me in Mountain Lion. npm install -g weinre – wprl Aug 21 '12 at 12:53
  • 2
    Link-only answers are better suited as a comment. – Joris Meys Dec 17 '13 at 17:19
5

This is an old question. But I'll still like to share my two cents.

I have been using jsconsole.com for remote debugging. It's easy. Just include a script tag and use console logs to debug by printing. This can also be used for debugging on a real device.

Kazekage Gaara
  • 14,972
  • 14
  • 61
  • 108
3

Old question, but I think I found the best solution, in my case you need to debug uiwebview, but I had no access to the IOS app and only to the html content and I had to view some JS logs, I added the following code to load the light firebug JS and show it automatically:

calling it from JS

var script = document.createElement('script');
script.type = 'text/javascript';
script.src = 'https://getfirebug.com/firebug-lite-debug.js';
document.head.appendChild(script);

or load it from html

<script type="text/javascript" src="https://getfirebug.com/firebug-lite-debug.js"></script>
talsibony
  • 8,448
  • 6
  • 47
  • 46
-1

You can set up a system like that used in PhoneGap to send messages from JavaScript to Objective-C and log from there. In a nutshell, they are setting document.location with a custom scheme and blocking that scheme in the delegate callback.

You can take advantage of the fact that a UIWebView is most of the delegates for a WebView. WebKit is technically undocumented for iPhone, but mostly the same as specified in the desktop WebKit headers, possibly including the WebScriptObject. I use this for debugging, but be sure to strip this code out before submitting to Apple.

To get a WebView from a UIWebView, implement a delegate method like -(void) webView:(id)inWebView didFinishLoadForFrame:(id)inWebFrame in a subclass of UIWebView. Call super if you use that one.

drawnonward
  • 53,459
  • 16
  • 107
  • 112