Can anyone recommend a free tool for generating Charts compatible with ASP.NET MVC?
Asked
Active
Viewed 6,618 times
4 Answers
4
Take a look at this free web control from Microsoft:
I tried it with regular web application, not MVC though. Works alright, a little finicky in some details.
What kind of charts you need to deal with? Some time ago I was looking for Gantt chart control, and really did not find any good free ones.
Regards, Anvar
Anvar
- 439
- 5
- 22
-
More info on how to get these charts to work with ASP.NET MVC [here](http://stackoverflow.com/questions/319835/new-aspnet-charting-controls-will-they-work-with-mvc-eventually#320891) and [here](http://code-inside.de/blog-in/2008/11/27/howto-use-the-new-aspnet-chart-controls-with-aspnet-mvc/) – Robert Harvey May 10 '10 at 16:14
-
Thanks, I suspected they work for both MVC and regular web apps similarly well. – Anvar May 10 '10 at 16:32
-
are these all server side charts? or can they be created using javascript? HMTL % compatible? – topwik Apr 10 '12 at 16:39
2
Use Google Chart Tools.
To clarify, GCT isn't specific to ASP.NET MVC. It's a hosted thing that you can call with Javascript. I've use it in MVC and regular ASP.NET project alike. Very clean and nice.
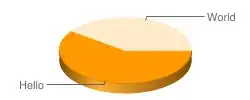
For instance, open your browser and go here:
https://chart.apis.google.com/chart?cht=p3&chd=t:60,40&chs=250x100&chl=Hello|World
You'll see this:
Community
- 1
- 1
sohtimsso1970
- 3,216
- 4
- 28
- 38
-
Sure, and that's an advantage. Offload the chart rendering to someone else (just like you offload your js, css content to a CDN). – sohtimsso1970 May 10 '10 at 16:17
-
If you can do that. It won't be possible in some scenarios, such as Intranet applications with business-sensitive data. – Robert Harvey May 10 '10 at 16:18
-
Good point on intranet apps. Not necessarily, on biz sensitive data. I went through that myself, while working on an app, but discovered that you can usually abstract the data pretty easily such that nothing useful is transmitted. In other words, your data points (10, 20, 30) are meaningless and you leave words (title, legend, etc) off of the GCT-rendered image and add those elsewhere. – sohtimsso1970 May 10 '10 at 16:23
-
Google Chart is a useful and easy to use tool. There are some minor issues I found when trying to define a custom width for labels on Y axis... I was not able to tweak it. Also we cannot expect Google to fix and make it quickly better, and our end-customer cannot complain about it, since there is no way to fix it. I think Google could improve it, but maybe they are busy with a lot of projects. – Junior Mayhé Nov 05 '12 at 18:40
0
you can use google chart tool. its easy to use and woks good. for refrence you can go through below url
http://code.google.com/apis/ajax/playground/?type=visualization
hope i would help you.
Mohan
- 83
- 1
- 5
0
The advantages of the Google Chart Tools are:
- A rich gallery of visualizations provided as:
- Image charts - using a simple URL request to a Google chart server
- Interactive charts - using a Google developed JavaScript library
- Can read live data from a variety of data sources
- Simple to use and free
Rippo
- 22,117
- 14
- 78
- 117
-
Yes, if I'm offering my site as intranet only, it'll won't work if customer doesn't have internet connection – Junior Mayhé May 10 '10 at 16:56
-
It would have been nice to include that in your question, in this case google charts wont work. Fusion Charts might be another option, plus they are fancy! – Rippo May 12 '10 at 09:57