3

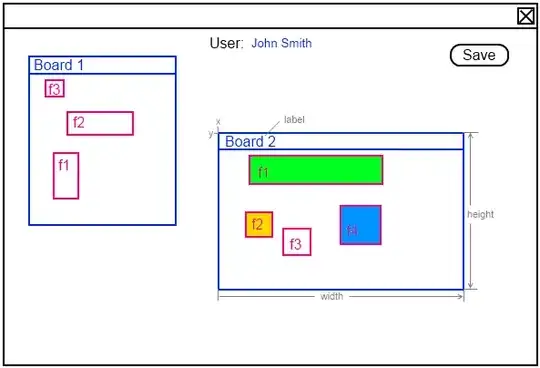
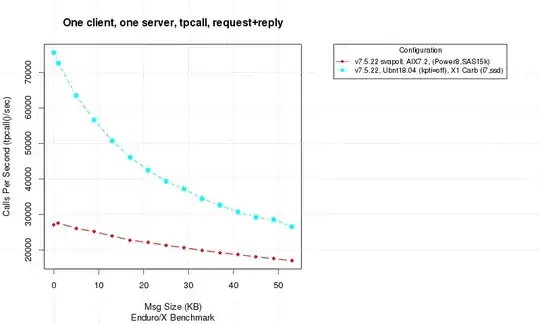
I wish to create something similar to the following types of discontinuous heat map in R:

enter image description here

enter image description here

My data is arranged as follows:

k_e percent time
 ..   ..     ..
 ..   ..     ..

I wish k_e to be x-axis, percent on y-axis and time to denote the color.

All links I could find plotted a continuous matrix http://www.r-bloggers.com/ggheat-a-ggplot2-style-heatmap-function/ or interpolated. But I wish neither of the aforementioned, I want to plot discontinuous heatmap as in the images above.

hrbrmstr
  • 77,368
  • 11
  • 139
  • 205
Abhishek Bhatia
  • 9,404
  • 26
  • 87
  • 142
  • 2
    If you "*wish neither of the aforementioned*", what do you wish then? Moreover, it would be helpful if you give a [reproducible example](http://stackoverflow.com/questions/5963269/how-to-make-a-great-r-reproducible-example?s=1|4.4776) – Jaap Jan 30 '15 at 10:38
  • If more than one data points fall into the same bin, shall the weights ("time") get averaged? – ziggystar Jan 30 '15 at 13:01
  • @ziggystar Yes, forgot to mention that, how is it possible to achieve this? – Abhishek Bhatia Jan 30 '15 at 16:38
  • @ziggystar okay sorry didnt check you code, you had already mentioned it. Thanks! – Abhishek Bhatia Jan 30 '15 at 16:41

2 Answers2

3

The second one is a hexbin plot If your (x,y) pairs are unique, you can do an x y plot, if that's what you want, you can try using base R plot functions:

x <- runif(100)
y<-runif(100)
time<-runif(100)

pal <- colorRampPalette(c('white','black'))
#cut creates 10 breaks and classify all the values in the time vector in
#one of the breaks, each of these values is then indexed by a color in the
#pal colorRampPalette.

cols <- pal(10)[as.numeric(cut(time,breaks = 10))]

#plot(x,y) creates the plot, pch sets the symbol to use and col the color 
of the points
plot(x,y,pch=19,col = cols)

With ggplot, you can also try:

library(ggplot2)
qplot(x,y,color=time)
NicE
  • 21,165
  • 3
  • 51
  • 68
1

Generate data

d <- data.frame(x=runif(100),y=runif(100),w=runif(100))

Using ggplot2

require(ggplot2)

Sample Count

The following code produces a discontinuous heatmap where color represents the number of items falling into a bin:

ggplot(d,aes(x=x,y=y)) + stat_bin2d(bins=10)

enter image description here

Average weight

The following code creates a discontinuous heatmap where color represents the average value of variable w for all samples inside the current bin.

ggplot(d,aes(x=x,y=y,z=w)) + stat_summary2d(bins=10)

enter image description here

ziggystar
  • 28,410
  • 9
  • 72
  • 124