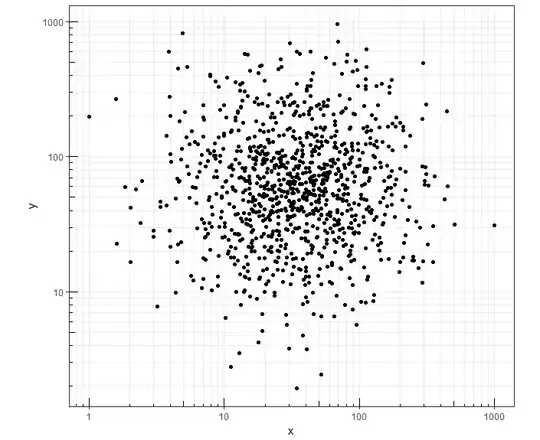
I am trying to create a plot with logarithmically spaced grids using ggplot2 just like in the below figure. I get equidistant grids, but not log spaced ones. I know I am missing some parameter which I don't seem to get as of now. I have seen a lot of questions on the topic like Pretty ticks for log normal scale using ggplot2 (dynamic not manual), but do not solve the problem I am looking for.
set.seed(5)
x <- rlnorm(1000, meanlog=3.5, sdlog=1)
y <- rlnorm(1000, meanlog=4.0, sdlog=1)
d <- data.frame(x, y)

plot(x, y, log="xy", las=1)
grid(nx=NULL, ny=NULL, col= "blue", lty="dotted", equilogs=FALSE)
library(magicaxis)
magaxis(side=1:2, ratio=0.5, unlog=FALSE, labels=FALSE)

library(ggplot2)
library(MASS)
library(scales)
a <- ggplot(d, aes(x=x, y=y)) + geom_point() +
     scale_x_log10(limits = c(1, NA),
                   labels = trans_format("log10", math_format(10^.x)),
                   breaks=trans_breaks("log10", function(x) 10^x, n=4)) +
     scale_y_log10(limits = c(1, NA),
                   labels = trans_format("log10", math_format(10^.x)),
                   breaks=trans_breaks("log10", function(x) 10^x, n=4)) +
     theme_bw() + theme(panel.grid.minor = element_line(color="blue", linetype="dotted"), panel.grid.major = element_line(color="blue", linetype="dotted"))
a + annotation_logticks(base = 10)