Before we actually go into what that MATLAB command does, you probably want to know what a spectrogram is. That way you'll get more meaning into how each parameter works.
A spectrogram is a visual representation of the Short-Time Fourier Transform. Think of this as taking chunks of an input signal and applying a local Fourier Transform on each chunk. Each chunk has a specified width and you apply a Fourier Transform to this chunk. You should take note that each chunk has an associated frequency distribution. For each chunk that is centred at a specific time point in your time signal, you get a bunch of frequency components. The collection of all of these frequency components at each chunk and plotted all together is what is essentially a spectrogram.
The spectrogram is a 2D visual heat map where the horizontal axis represents the time of the signal and the vertical axis represents the frequency axis. What is visualized is an image where darker colours means that for a particular time point and a particular frequency, the lower in magnitude the frequency component is, the darker the colour. Similarly, the higher in magnitude the frequency component is, the lighter the colour.
Here's one perfect example of a spectrogram:
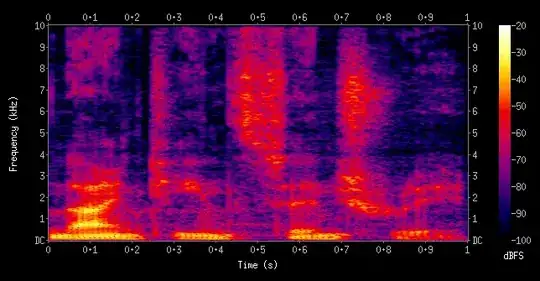
Source: Wikipedia
Therefore, for each time point, we see a distribution of frequency components. Think of each column as the frequency decomposition of a chunk centred at this time point. For each column, we see a varying spectrum of colours. The darker the colour is, the lower the magnitude component at that frequency is and vice-versa.
So!... now you're armed with that, let's go into how MATLAB works in terms of the function and its parameters. The way you are calling spectrogram conforms to this version of the function:
spectrogram(x,window,noverlap,nfft,fs)
Let's go through each parameter one by one so you can get a greater understanding of what each does:
x - This is the input time-domain signal you wish to find the spectrogram of. It can't get much simpler than that. In your case, the signal you want to find the spectrogram of is defined in the following code:
N=5000;
phi = (rand(1,N)-0.5)*pi;
a = tan((0.5.*phi));
i = 2.*a./(1-a.^2);
Here, i is the signal you want to find the spectrogram of.
window - If you recall, we decompose the image into chunks, and each chunk has a specified width. window defines the width of each chunk in terms of samples. As this is a discrete-time signal, you know that this signal was sampled with a particular sampling frequency and sampling period. You can determine how large the window is in terms of samples by:
window_samples = window_time/Ts
Ts is the sampling time of your signal. Setting the window size is actually very empirical and requires a lot of experimentation. Basically, the larger the window size, the better frequency resolution you get as you're capturing more of the frequencies, but the time localization is poor. Similarly, the smaller the window size, the better localization you have in time, but you don't get that great of a frequency decomposition. I don't have any suggestions here on what the most optimal size is... which is why wavelets are preferred when it comes to time-frequency decomposition. For each "chunk", the chunks get decomposed into smaller chunks of a dynamic width so you get a mixture of good time and frequency localization.
noverlap - Another way to ensure good frequency localization is that the chunks are overlapping. A proper spectrogram ensures that each chunk has a certain number of samples that are overlapping for each chunk and noverlap defines how many samples are overlapped in each window. The default is 50% of the width of each chunk.
nfft - You are essentially taking the FFT of each chunk. nfft tells you how many FFT points are desired to be computed per chunk. The default number of points is the largest of either 256, or floor(log2(N)) where N is the length of the signal. nfft also gives a measure of how fine-grained the frequency resolution will be. A higher number of FFT points would give higher frequency resolution and thus showing fine-grained details along the frequency axis of the spectrogram if visualised.
fs - The sampling frequency of your signal. The default is 1 Hz, but you can override this to whatever the sampling frequency your signal is at.
Therefore, what you should probably take out of this is that I can't really tell you how to set the parameters. It all depends on what signal you have, but hopefully the above explanation will give you a better idea of how to set the parameters.
Good luck!