60

Assuming we have a polygon coordinates as polygon = [(x1, y1), (x2, y2), ...], the following code displays the polygon:

import matplotlib.pyplot as plt
plt.fill(*zip(*polygon))
plt.show()

By default it is trying to adjust the aspect ratio so that the polygon (or whatever other diagram) fits inside the window, and automatically changing it so that it fits even after resizing. Which is great in many cases, except when you are trying to estimate visually if the image is distorted. How to fix the aspect ratio to be strictly 1:1?

(Not sure if "aspect ratio" is the right term here, so in case it is not - I need both X and Y axes to have 1:1 scale, so that (0, 1) on both X and Y takes an exact same amount of screen space. And I need to keep it 1:1 no matter how I resize the window.)
Headcrab
  • 6,838
  • 8
  • 40
  • 45
  • Possible duplicate of [How to equalize the scales of x-axis and y-axis in Python matplotlib?](http://stackoverflow.com/questions/17990845/how-to-equalize-the-scales-of-x-axis-and-y-axis-in-python-matplotlib) – Trevor Boyd Smith Oct 21 '16 at 16:04
  • 1
    This question, asked on May 29, 2010, is a possible duplicate of a question asked on August 1, 2013, and not the other way around. It may already have an answer in the future (which is now the past). Wtf, rly... – Headcrab Oct 24 '16 at 06:41

4 Answers4

104

Does it help to use:

plt.axis('equal')
Olivier Verdier
  • 46,998
  • 29
  • 98
  • 90
  • 12
    you can also use `plt.axis('scaled')` – Saullo G. P. Castro Jun 21 '13 at 14:45
  • I don't understand why, but contrary to `scaled` setting, when I changed `ylim` and `xlim` after `axis('equal')`, the tick sizes became *unequal*, and even some data from my scatter plot became cropped out... – Tomasz Gandor Jun 13 '19 at 12:26
  • what is the difference of using plt.axis('scaled') and plt.axis('equal')? – Ernesto Ruiz Mar 10 '23 at 21:11
  • By default, it seems that `plt.axis('equal')` adjusts the vertical height of the axes to achieve equal scales along X and Y. Is it possible to have matplotlib adjust the horizontal size instead? – Sia May 11 '23 at 04:11
36

'scaled' using plt

The best thing is to use:

 plt.axis('scaled')

As Saullo Castro said. Because with equal you can't change one axis limit without changing the other so if you want to fit all non-squared figures you will have a lot of white space.

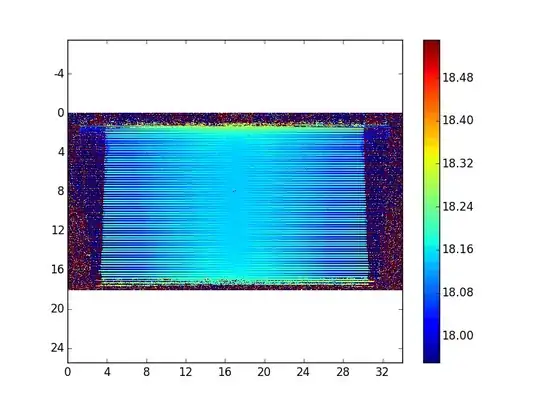
Equal

enter image description here

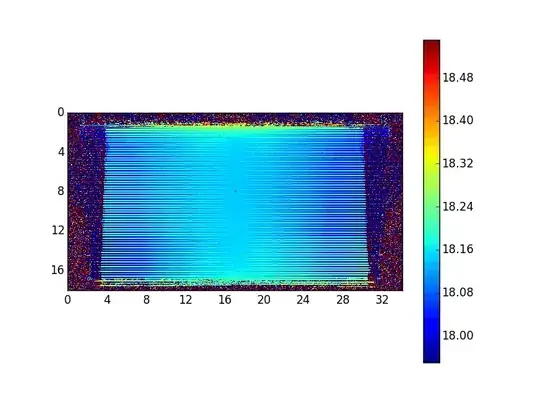
Scaled

enter image description here

'equal' using ax

Alternatively, you can use the axes class.

fig = plt.figure()
ax = figure.add_subplot(111)
ax.imshow(image)
ax.axes.set_aspect('equal')
G M
  • 20,759
  • 10
  • 81
  • 84
19

There is, I'm sure, a way to set this directly as part of your plot command, but I don't remember the trick. To do it after the fact you can use the current axis and set it's aspect ratio with "set_aspect('equal')". In your example:

import matplotlib.pyplot as plt
plt.fill(*zip(*polygon))
plt.axes().set_aspect('equal', 'datalim')
plt.show()

I use this all the time and it's from the examples on the matplotlib website.

user348863
  • 321
  • 2
  • 2
  • 2
    Try also `pylab.gca().set_aspect('equal', 'box')`. 'box' adjusts *both* of the axis limits (no whitespace around e.g. contourplot). 'datalim' adjusts only one of the limits (only x or y whitespace desappears). There is also 'box-forced' for exotic shared axis. – Juha Mar 20 '13 at 12:19
1

Better plt.axis('scaling'), it works better if you want to modify the axes with xlim() and ylim().

Specur
  • 3,240
  • 4
  • 23
  • 25
ledmike
  • 19
  • 1