13

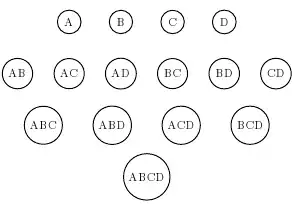
I need to align each row of the graph to the center. I am trying to do it with xshift. Here the code:

    \begin{tikzpicture}[node distance=1.5cm, auto, text centered]
    \tikzstyle{every node}=[draw,ball];
    \begin{scope}[xshift=1.5cm]
        \node (A) {A};
        \node [right of=A] (B) {B};
        \node [right of=B] (C) {C};
        \node [right of=C] (D) {D};
    \end{scope}
    \begin{scope}[yshift=-1.5cm]
        \node (AB) {AB};
        \node [right of=AB] (AC) {AC};
        \node [right of=AC] (AD) {AD};
        \node [right of=AD] (BC) {BC};
        \node [right of=BC] (BD) {BD};
        \node [right of=BD] (CD) {CD};
    \end{scope}
    \begin{scope}[yshift=-3cm,node distance=2cm,xshift=1cm]
        \node (ABC) {ABC};
        \node [right of=ABC] (ABD) {ABD};
        \node [right of=ABD] (ACD) {ACD};
        \node [right of=ACD] (BCD) {BCD};
    \end{scope}
    \begin{scope}[xshift=4cm, yshift=-4.5cm, node distance=2cm]
        \node (ABCD) {ABCD};
    \end{scope}
\end{tikzpicture}

Is there any other way to do it? Do not like to change xshift values every time.
mindhex
  • 133
  • 1
  • 1
  • 6
  • As a workaround, could you make each `scope` its own picture? Then you can center the whole stack of pictures. – Geoff May 31 '10 at 14:02
  • I want to draw links between nodes on different rows (after proper alignment). So, I should use "overlay" / "remember picture" in each tikzpicture, which is kind of complicated. I think maybe there is some command which changes default node alignment from left to center... – mindhex May 31 '10 at 15:11
  • I've been struggling with the same(-ish) problem, so far without a solution. +1 for the interesting question. – Pieter May 31 '10 at 21:03
  • What is your application? If you're drawing a tree (as it seems) you can use more descriptive relative location information, and let Tikz handle placement nicely. – Geoff Jun 02 '10 at 17:05
  • It is not a tree, elements has multiple parents. I can not use any relative alignment (or matrix), because each row has different number of elements. You can see the graph here: http://rghost.ru/1784010/private/6a49ce8ebbc1ae2e2456310efc957e49/image.png Looks like graphviz + dot2tex is best option for this kind of problem... – mindhex Jun 02 '10 at 19:34
  • 1
    These kind of diagrams are called Hasse diagrams by the way. – Pieter Jun 02 '10 at 20:06

1 Answers1

6

You can make each row its own matrix, allowing you to effectively group a set of nodes into one.

Your Example

\begin{tikzpicture}[auto]
    \begin{scope}[]
        \matrix[nodes={draw,ball}, column sep=1cm]{
            \node (A) {A}; &
            \node (B) {B}; &
            \node (C) {C}; &
            \node (D) {D}; \\
            };
    \end{scope}
    \begin{scope}[yshift=-1.5cm]
        \matrix[nodes={draw,ball}, column sep=1cm]{
            \node (AB) {AB}; &
            \node (AC) {AC}; &
            \node (AD) {AD}; &
            \node (BC) {BC}; &
            \node (BD) {BD}; &
            \node (CD) {CD}; \\
        };
     \end{scope}
     \begin{scope}[yshift=-3cm]
        \matrix[nodes={draw,ball}, column sep=1cm]{
            \node (ABC) {ABC}; &
            \node (ABD) {ABD}; &
            \node (ACD) {ACD}; &
            \node (BCD) {BCD}; \\
        };
    \end{scope}
    \begin{scope}[yshift=-4.5cm]
        \matrix[nodes={draw,ball}, column sep=1cm]{
            \node (ABCD) {ABCD}; \\
        };
    \end{scope}
\end{tikzpicture}

Note: be sure to \usetikzlibrary{matrix}

Results in

alt text

(I made up my own ball style.)

Glorfindel
  • 21,988
  • 13
  • 81
  • 109
Geoff
  • 7,935
  • 3
  • 35
  • 43