I am trying to find a suitable display to illustrate various properties within and across school classes. For each class there is only 15-30 data points (pupils).
Right now i am leaning towards a whisker-less boxplot, showing only 1.,2. and 3. quartile + datapoints more then e.g. 1 population SD +/- the sample median.
This I can do.
However - I need to show this graph to some teachers, in order to gauge what they like most. I'd like to compare my graph with a normal boxplot. But the normal boxplot looks the same if there is only one outlier, or e.g. 5 outliers at the same value. In this case this would be a deal-breaker.
e.g.
test <-structure(list(value = c(3, 5, 3, 3, 6, 4, 5, 4, 6, 4, 6, 4,
4, 6, 5, 3, 3, 4, 4, 4, 3, 4, 4, 4, 3, 4, 5, 6, 6, 4, 3, 5, 4,
6, 5, 6, 4, 5, 5, 3, 4, 4, 6, 4, 4, 5, 5, 3, 4, 5, 8, 8, 8, 8,
9, 6, 6, 7, 6, 9), places = structure(c(1L, 2L, 1L, 1L, 1L, 2L,
1L, 2L, 1L, 2L, 1L, 2L, 2L, 2L, 2L, 2L, 1L, 1L, 2L, 2L, 2L, 1L,
2L, 1L, 1L, 1L, 1L, 2L, 1L, 2L, 1L, 2L, 2L, 2L, 1L, 2L, 1L, 2L,
2L, 1L, 1L, 2L, 2L, 1L, 1L, 1L, 1L, 2L, 1L, 1L, 2L, 2L, 2L, 1L,
1L, 2L, 2L, 1L, 2L, 1L), .Label = c("a", "b"), class = "factor")), .Names = c("value",
"places"), row.names = c(NA, -60L), class = "data.frame")
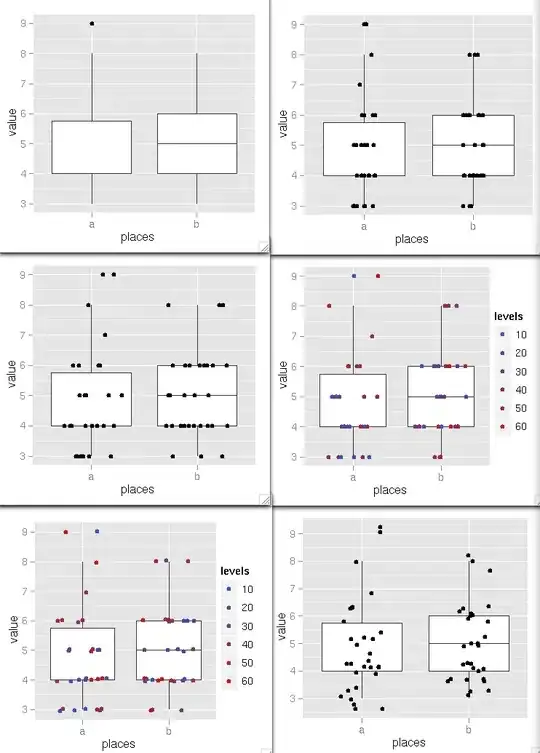
ggplot(test, aes(x=places,y=value))+geom_boxplot()
Here there are two outliers at ("a",9) - but only one "dot" shown.
So my question: How to jitter the outliers. And - what kind of display would you suggest for this kind of data?