1

I would like to reduce bar gap and keep bar width of stacked bar plot.

Stacked bar plot:

p <- ggplot(dat, aes(x = plant, y = percentage*100, fill = group)) + 
  geom_bar(stat = "identity", width =0.20)

enter image description here

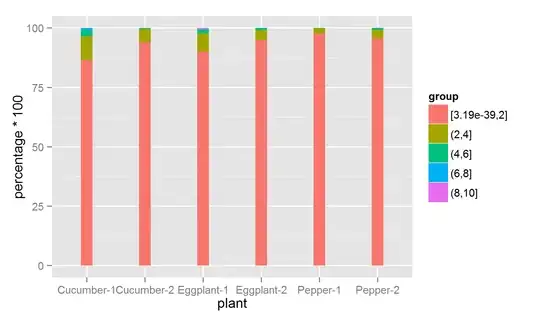
and then I want to change bar gaps by position=position_dodge(0.9):

p <- ggplot(dat, aes(x = plant, y = percentage*100, fill = group)) + 
  geom_bar(stat = "identity", position=position_dodge(0.9),width =0.20)

This solution can change bar gaps, but bars were unstacked. So how to change bar gap and keep bar width and stacked? Thank you in advance!

enter image description here

My data:

structure(list(plant = structure(c(1L, 1L, 1L, 1L, 1L, 2L), .Label = c("Cucumber-1", 
"Cucumber-2", "Eggplant-1", "Eggplant-2", "Pepper-1", "Pepper-2"
), class = "factor"), group = structure(c(1L, 2L, 3L, 4L, 5L, 
1L), .Label = c("[3.19e-39,2]", "(2,4]", "(4,6]", "(6,8]", "(8,10]"
), class = "factor"), n = c(14729L, 1670L, 447L, 131L, 16L, 20206L
), percentage = c(0.866768669452127, 0.0982757606073089, 0.0263049490966869, 
0.00770905667039369, 0.000941564173483199, 0.941039493293592)), .Names = c("plant", 
"group", "n", "percentage"), class = c("grouped_df", "tbl_df", 
"tbl", "data.frame"), row.names = c(NA, -6L), vars = list(plant), drop = TRUE, indices = list(
    0:4, 5L), group_sizes = c(5L, 1L), biggest_group_size = 5L, labels = structure(list(
    plant = structure(1:2, .Label = c("Cucumber-1", "Cucumber-2", 
    "Eggplant-1", "Eggplant-2", "Pepper-1", "Pepper-2"), class = "factor")), class = "data.frame", row.names = c(NA, 
-2L), .Names = "plant", vars = list(plant)))
just_rookie
  • 873
  • 12
  • 33
  • Remove `position = position_dodge` It causes bars to appear side by side. a simple example might help to clarify your question. – Koundy May 11 '15 at 05:28
  • Hi, Thank you for your quick reply. I have updated my post, and the qustion should be much clearer. – just_rookie May 11 '15 at 05:38
  • @LJW I have read this post before, but the solution could not solve my question. – just_rookie May 11 '15 at 05:59
  • @LJW First, the barplot should be a stacked barplot(stacked percentage barplot), and then I want to keep bar width unchanged. Finally, make stacked bars more closer to each other, but not side by side. – just_rookie May 11 '15 at 06:10

1 Answers1

0

position = position_dodge is used to show the fill part of bar graphs side by side. I cannot particularly find a solution to this. However, when I face such problem, I adjust the width of the entire graph to adjust width of the bars. Consider the following example and see the graphs that are saved when you adjust the width. Hope this helps. The point is if you make the bar width narrower and decrease the space between the bars, ultimately your graph width decreases.

ggplot(diamonds, aes(clarity, fill=cut)) + geom_bar()
ggsave(filename = "trial1.png",plot = P,width=15,height = 10)

enter image description here

ggsave(filename = "trial2.png",plot = P,width=5,height = 10)

enter image description here

Koundy
  • 5,265
  • 3
  • 24
  • 37
  • Thank you for your solution. The solution should be helpful, but not so elegent. It's hard to adjust bar width, bar gap and plot width into harmony. – just_rookie May 11 '15 at 06:26