I have used ggplot2 to draw a stacked barplot, and I want to fill the barplot with patterns. But it seems that the problem is very complicated to be solved by ggplot2.
So is there a way to fill stacked barplot with patterns or textures with base R or with another R package?
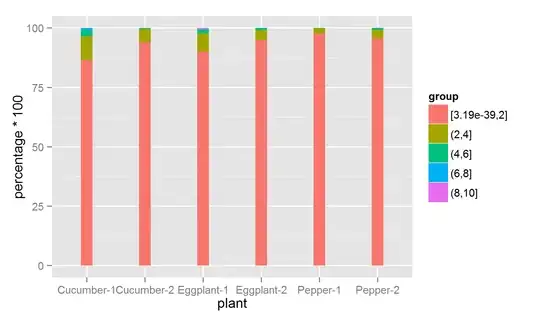
My plot is similar to this barplot:
and I want the barplot looks like this, fill with patterns or textures:

My data is from my previous post:
plant   group   n   percentage
1   Cucumber-1  [3.19e-39,2]    14729   0.8667686695
2   Cucumber-1  (2,4]   1670    0.0982757606
3   Cucumber-1  (4,6]   447 0.0263049491
4   Cucumber-1  (6,8]   131 0.0077090567
5   Cucumber-1  (8,10]  16  0.0009415642
6   Cucumber-2  [3.19e-39,2]    20206   0.9410394933
7   Cucumber-2  (2,4]   1155    0.0537909836
8   Cucumber-2  (4,6]   90  0.0041915052
9   Cucumber-2  (6,8]   16  0.0007451565
10  Cucumber-2  (8,10]  5   0.0002328614
11  Eggplant-1  [3.19e-39,2]    11273   0.9012631916
12  Eggplant-1  (2,4]   960 0.0767508794
13  Eggplant-1  (4,6]   181 0.0144707387
14  Eggplant-1  (6,8]   31  0.0024784138
15  Eggplant-1  (8,10]  63  0.0050367765
16  Eggplant-2  [3.19e-39,2]    16483   0.9493721921
17  Eggplant-2  (2,4]   725 0.0417578620
18  Eggplant-2  (4,6]   140 0.0080635871
19  Eggplant-2  (6,8]   12  0.0006911646
20  Eggplant-2  (8,10]  2   0.0001151941
21  Pepper-1    [3.19e-39,2]    4452    0.9763157895
22  Pepper-1    (2,4]   97  0.0212719298
23  Pepper-1    (4,6]   11  0.0024122807
24  Pepper-2    [3.19e-39,2]    23704   0.9560763119
25  Pepper-2    (2,4]   905 0.0365022385
26  Pepper-2    (4,6]   184 0.0074214496