44

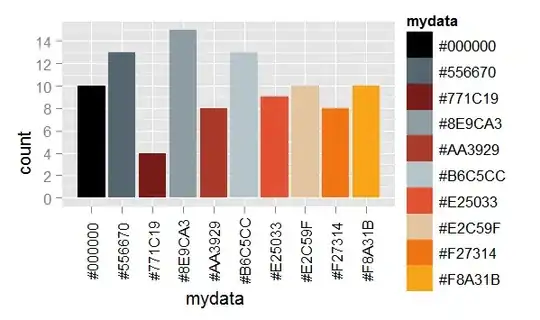
Does anyone know how to use a pre-defined color palette in ggplot?

I have a vector of colors I would like to use:

rhg_cols <- c("#771C19", "#AA3929", "#E25033", "#F27314", "#F8A31B", 
              "#E2C59F", "#B6C5CC", "#8E9CA3", "#556670", "#000000")

But when I try to pass it to nothing happened

ggplot(mydata, aes(factor(phone_partner_products)), color = rhg_cols) +
  geom_bar()
Henrik
  • 65,555
  • 14
  • 143
  • 159

4 Answers4

42

You must put colour = rhg_cols inside aes(). As far as I can tell, you want to apply gradient to bars (in barplot) with factor variable on the abscissa? Then use fill - try this instead:

ggplot(mydata, aes(factor(phone_partner_products), fill = factor(phone_partner_products))) +
  geom_bar() + 
  scale_fill_manual(values = rhg_cols)

or try to achieve approximate replica with:

ggplot(mydata, aes(factor(phone_partner_products), fill = phone_partner_products))) +
  geom_bar() + 
  scale_fill_gradient(low = "#771C19", high = "#000000")

Notice that in second case a continuous variable is passed to fill aesthetics, therefore scale_fill_gradient is passed afterwards. If you pass a factor to the fill aes, you must stick with scale_fill_manual(values = rhg_cols).

MikeRSpencer
  • 1,276
  • 10
  • 24
aL3xa
  • 35,415
  • 18
  • 79
  • 112
30

If the colours are a palette, use scale_colour_manual:

ggplot(mydata, aes(factor(phone_partner_products), colour = colour_variable)) +
  scale_colour_manual(values = rhg_cols)
JD Long
  • 59,675
  • 58
  • 202
  • 294
hadley
  • 102,019
  • 32
  • 183
  • 245
  • 2
    This pointed me in the right direction, however the argument to `scale_colour_manual()` had to be `values=...` to get it to work. – mvds May 11 '11 at 23:16
  • 1
    Just adding from my experience. If your vector is named (i.e. each hex value has a color name), then you'll want to unname the vector before passing it to scale_color_manual, as otherwise it will try to match names to the color variable. So, it'd go like ```scale_colour_manual(values = unname(rhg_cols))``` – Taraas May 21 '18 at 18:58
11

First add, the colours to your data set:

mydata$col <- rhg_cols

Then map colour to that column and use scale_colour_identity

ggplot(mydata, aes(factor(phone_partner_products, colour = col))) + 
  geom_bar() + 
  scale_colour_identity()
hadley
  • 102,019
  • 32
  • 183
  • 245
10

Since the colors you want ARE the values in the color aesthetic, what you really want is the identity scale, in this case scale_fill_identity.

 ggplot(mydata, aes(factor(phone_partner_products)), color=rhg_cols) +
   geom_bar() +
   scale_fill_identity())

Since you didn't supply data, I'm going to use a slightly different example using your color data:

 rhg_cols <- c("#771C19","#AA3929","#E25033","#F27314","#F8A31B",
               "#E2C59F","#B6C5CC","#8E9CA3","#556670","#000000")
 mydata <- sample(rhg_cols, 100, replace = TRUE)
 qplot(mydata, fill = mydata) +
   scale_fill_identity()

enter image description here


note: I omitted + opts(axis.text.x=theme_text(angle=90)) for clarity in the example.

Henrik
  • 65,555
  • 14
  • 143
  • 159
Alex Brown
  • 41,819
  • 10
  • 94
  • 108