I've got an incomplete timeseries meaning that there is a big gap in the observations:
dat <- data.frame(
  date = c(2000, 2001, 2002, 2009, 2010, 2011),
  value1 = runif(6,1,100),
  value2 = runif(6,1,100)
)
library("reshape2")
dat_long <- melt(dat, id="date")
dat_long$time <- ifelse(dat_long$date < 2009, "early", "late")
I would like to plot dat using ggplot2, but with a gap between the observations 2002 and 2009. Effectively, there shall be two group of lines: One for 2000, 2001 and 2002, and the other one for 2009, 2010 and 2011 (hence, grouped by time).
According Line break when no data in ggplot2, I tried
library("ggplot2")
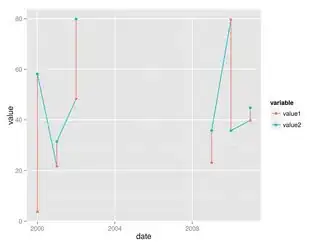
ggplot(data=dat_long, aes(x=date, y=value, group=variable)) +
  geom_line(aes(color=variable, group=time)) +
  geom_point(aes(color=variable))
But this simply combines all the points:
The difference between my question and Line break when no data in ggplot2 is that I have multiple lines, which obviously prohibits the use of group=time in my geom_line(aes(...)) call.
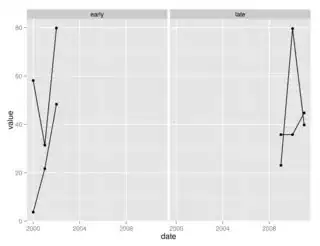
Then I tried facets as a second-best solution:
ggplot(data=dat, aes(x=date, y=value, group=variable)) +
  geom_line() + geom_point() + facet_grid( ~ time)
But this draws the entire scale along the x axis even though there are no observations:


