Here is a sample heatmap I made: 
    id<-c(1:10)
    var1<-c(rnorm(10,3,1))
    var2<-c(rnorm(10,5,1))
    dat<-data.frame(cbind(id,var1,var2))
    data<-melt(dat,id.var="id",value.var=c("var1","var2"))
    ggplot(data, aes(variable, id)) + geom_tile(aes(fill = value), colour = "white") + scale_fill_gradient(low = "gray", high = "black")
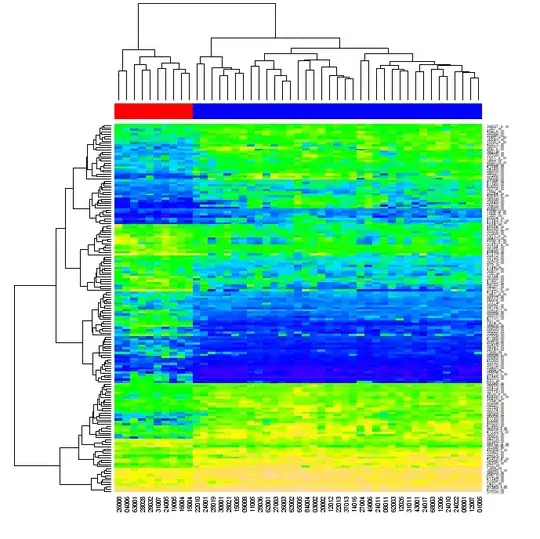
I want to change the size of each cell in the heat map. I want each cell to be a small square, something like:

I have tried:
ggplot(data, aes(variable, id)) + geom_tile(aes(fill = value), colour = "white",size=4) + scale_fill_gradient(low = "gray", high = "black")

ggplot(data, aes(variable, id,height=200,width=200)) + geom_tile(aes(fill = value), colour = "white",size=4) + scale_fill_gradient(low = "gray", high = "black")
But neither of them work.