5

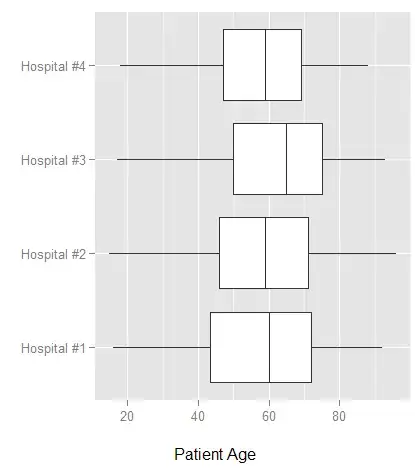
I would like to change the stacking order of hospitals in the diagram below so #1 is at the top and #4 at the bottom.

The diagram was produced with

ggplot(survey,aes(x=hospital, y=age))+geom_boxplot()+coord_flip()+xlab("")+ylab ("\nPatient Age")

and I need the top->down order to be the reverse of what is now. I'm not sure why it comes the way it does now. The 'hospital' column is a factor in case it matters.

Many thanks!

alt text

wishihadabettername
  • 14,231
  • 21
  • 68
  • 85

1 Answers1

10

You have a few options. The easiest would be to add

p + scale_x_reverse()

to the plot. You could also reverse the levels of the factor

relevel(survey$hospital, rev(levels(survey$hospital))) -> survey$hospital

Or, you could determine the order you want the boxes by hand with xlim()

p + xlim("Hospital #4","Hospital #3","Hospital #2","Hospital #1")
JoFrhwld
  • 8,867
  • 4
  • 37
  • 32
  • Semantically, I think the second option is best. It separates manipulating the form of the data from the plotting code. – Richie Cotton Aug 12 '10 at 09:49
  • The first one gives an error: Error: Non-continuous variable supplied to scale_x_reverse. In addition: Warning message: In Ops.factor(x) : - not meaningful for factors but the third one worked fine. I didn't relevel them because if I display survey$hospital, they are already leveled in the natural order (1, 2, 3, 4). – wishihadabettername Aug 12 '10 at 12:39
  • 2
    I think `scale_x_reverse` is only meant for continuous values. – mindless.panda Jul 13 '12 at 23:34
  • @RichieCotton, curious why you prefer manipulating the dataframe before plotting - my preference is to leave the df as unadulterated as possible and do manipulations in the plot where possible/reasonable. If something is wrong w/ the plotting code, I like to be able to comb through the original df. – NiuBiBang Dec 27 '13 at 05:07
  • @DaNiu You often need to draw a plot several times before you get it right. It's quicker to redraw if the data is already in the correct form (rather than remanipulating it each time). More importantly, separating the data manipulation step from the plotting step makes the code more readable. – Richie Cotton Jan 02 '14 at 11:05