0

I'm using Visual Studio 2015, working with WinForms.

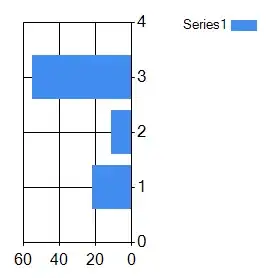
I link 2 images to make you guys easier to understand what I want to do:

Example 1

Example 2

In the example 1 we have 10 values with an automatic width, this is the size I want always for bars, but this is a dynamic chart so when there are less than 10 values it just fills to graph as you can see in example 2. I want the same size always, the size of the example 1, have tried to specify using:

chrt_ventesArticles.Series[Conversion.Texto(f_cursor.Campo(1))]["PixelPointWidth"] = "100";

And tried too:

chrt_ventesArticles.Series[Conversion.Texto(f_cursor.Campo(1))]["PixelPointWidth"] = Conversion.Texto(Math.Round(chrt_ventesArticles.ChartAreas[0].InnerPlotPosition.Height, 0));

But it isn't working as it should, depending on the number of values it haves a different size.

Any ideas about how to do it?
Fran
  • 51
  • 2
  • 11

1 Answers1

1

To space the bars evenly over a fixed number of slots you need to set the Minimum and Maximum values to display on an Axis.

Here you have a Bar chart and want to display the bars in a 10 slots.

So you write maybe:

yourCharArea.AxisX.Minimum = 0;
yourCharArea.AxisX.Maximum = 10;

Now you get both:

  • Always the same width of the Bars, even while some DataPoints are missing.
  • But also still the automatic scaling when you resize the Chart itself.

The latter will not work when you set the with of the Bars in pixels..!

Before and after:

enter image description hereenter image description here

TaW
  • 53,122
  • 8
  • 69
  • 111
  • It just works when you have one serie, I need 10 series. Thank you anyways. – Fran Apr 12 '16 at 12:04
  • So? It works for any number of series you add. All series share in a chartarea share all their axes! – TaW Apr 12 '16 at 15:48
  • Note that I am not sure using 10 series with only 1 point is such a good idea. The normal way is to add 10 points to one series. You still can set the colors and also create a new Legend if you want to.. – TaW Apr 12 '16 at 22:13
  • TaW if you put 10 series and specify 0/10 min/max, you have space for 100 points. – Fran Apr 13 '16 at 08:25
  • Yes, that creates space for 100 points. You could widen the bars using the `"PixelPointWidth"` special property and take the `InnerPlotPosition.Height` [converted to pixels](http://stackoverflow.com/questions/36221672/constrain-aspect-ratio-in-windowsforms-datavisualization-chart/36248343?s=1|0.6602#36248343) and dividing it by 10, but it will still not look perfect, as the points will 'drift' as each is positioned for the next series.. – TaW Apr 13 '16 at 08:34
  • - Look [here for an example](http://stackoverflow.com/questions/35791944/how-to-add-data-table-with-legend-keys-to-a-ms-chart-in-c/35795254?s=2|1.7186#35795254) how to create a (rather more complex) custom Legend.. – TaW Apr 13 '16 at 08:35
  • Whatever there need to be a method to do what I want to do without a custom legend, and there is no no way eithout custom legend to put a single legend for each point? – Fran Apr 13 '16 at 09:48
  • Well, since you have switched off any grid and ticks etc in the x-axis anyway, you certainly can stay with the multiple series solution. Simply make sure to pick a suitable value for the "PixelPointWidth" upon each resize of the chart! Setting it to chart.ClientSize.Height / chart.Series.Count is a rough calculation, that may be good enough.. You still need to set Minimum&Maximum and also need to use x-values for the datapoints that correspond to the slot you want to fill.. If you don't alsways want to add all 10 series divide by 10 instead of chart.Series.Count , of course! – TaW Apr 13 '16 at 09:59
  • Do you know any method to subtract the grid and ticks in the x-axis from the total count of pixels of the chart area? – Fran Apr 22 '16 at 11:47
  • The direct way is to get rid of them by switching them off (...Endbled = false;) If you want to know their pixel size you could turn them on and off for each axis you want to and compare the results; to calculate the pixel size of the [ChartClientArea see here..](http://stackoverflow.com/questions/36766330/detect-which-chartarea-is-being-double-clicked/36767415#36767415) – TaW Apr 22 '16 at 14:01