1

With data

value <- c(9, 4, 10, 7, 10, 
           10, 10, 4, 10, 
           4, 10, 2, 5, 5, 4)

names  <-  c("a","b",
             "c","d","e",
             "f", "g","h",
             "i","j","k","l",
             "m","n","p")

df <- data.frame(value, names)
df$names <- as.character(df$names)

p <- ggplot(data = df, aes(y = value,x= names,group=1))+
  geom_point(color = I("red"),shape=23, lwd=3,fill="red")+
  geom_line(group = I(1),color = I("red"))+
  theme_bw()+
  coord_flip()
p + xlab("") +ylab("") 

I produce this

enter image description here

But now I would like to create plot similar picture below, where "a", "b", "c" and "D" would be x aes labels and belong to PART 1 and names "p", "n", "m", "i", "k" would belong in PART 2 (and so on). the key part here is how to add circles inside plot.

I've also looked here How can I add freehand red circles to a ggplot2 graph?

but no luck.

enter image description here

If this in upper pocture is not possible, than I would like my output to be like below picture
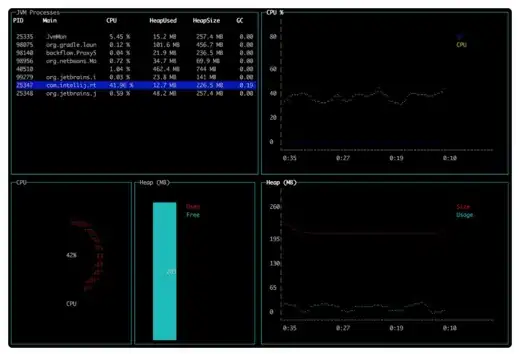
enter image description here

Community
  • 1
  • 1
Miha
  • 2,559
  • 2
  • 19
  • 34

1 Answers1

1

In order to achieve the facetting by part as in your last plot you can create a new column that groups your values, e.g.:

df$part <- rep(c("part3", "part2", "part1"), each = 5)

In order to plot the open circles you can add another geom_point() layer. I created a new data frame that consists of all combinations of names and value for each part:

library(dplyr)
library(tidyr)

df2 <- df %>% 
  group_by(part, names) %>% 
  expand(value = min(df$value):max(df$value))

Then you plot a facetted plot with circles:

ggplot() +
  geom_point(data = df2, aes(x = value, y = names),
             shape = 1) +
  geom_point(data = df, aes(y = names, x = value, group = 1), colour = I("red"), shape = 23, lwd = 3, fill = "red") +
  geom_line(data = df, aes(y = names, x = value, group = 1), group = I(1),color = I("red")) +
    theme_bw() +
  facet_wrap(~part, ncol = 1, scales = "free_y")

Note that I swapped x and y values as coord_flip() cannot be used with scales = "free_y" which is however necessary if you want only those names which have values in the respective facet.

enter image description here

erc
  • 10,113
  • 11
  • 57
  • 88
  • thanks that works perfectly. Do you know, how would I add or label vertical groups i.e., PART1, PART2, PART3, PART4, PART5, like in the last pocture a posted? – Miha May 25 '16 at 11:04
  • 1
    This is it. Thanks. – Miha May 25 '16 at 12:21