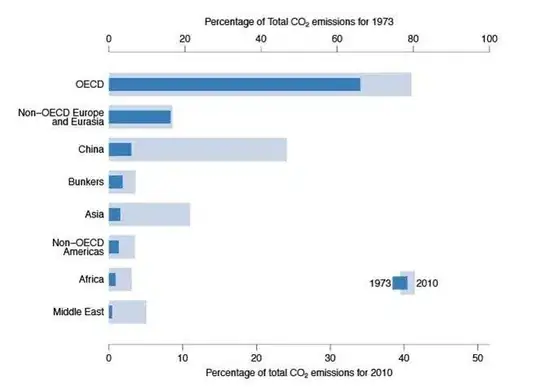
I enjoy trying to build these kinds of plots from primitive graphics elements and manual coordinate computations. It gives you complete control over all aspects of the plot, at the expense of a fair amount of complexity and intricacy in the plotting code.
Here you go:

## generate data
df <- data.frame(region=rep(c('OECD','Non-OECD Europe and Eurasia','China','Bunkers','Asia','Non-OECD Americas','Africa','Middle East'),each=2L),year=c(1973L,2010L),emissions=c(68,41,17,9,7,23,5,4,4,12,3,4,2,3,1,7));
df;
##                         region year emissions
## 1                         OECD 1973        68
## 2                         OECD 2010        41
## 3  Non-OECD Europe and Eurasia 1973        17
## 4  Non-OECD Europe and Eurasia 2010         9
## 5                        China 1973         7
## 6                        China 2010        23
## 7                      Bunkers 1973         5
## 8                      Bunkers 2010         4
## 9                         Asia 1973         4
## 10                        Asia 2010        12
## 11           Non-OECD Americas 1973         3
## 12           Non-OECD Americas 2010         4
## 13                      Africa 1973         2
## 14                      Africa 2010         3
## 15                 Middle East 1973         1
## 16                 Middle East 2010         7
## set configuration parameters
xlim <- c(0,1);
ylim <- c(0,1);
ybararea.pct <- 86;
ybargap.ratio <- 2.2; ## bar/gap; really describes larger bars, i.e. 2010 bars to gaps
ybar1973.pct <- 55; ## 1973 pct height of 2010
x.range.1973 <- c(0,100);
x.ticks.1973 <- seq(x.range.1973[1L],x.range.1973[2L],20);
x.range.2010 <- c(0,51.5);
x.ticks.2010 <- seq(x.range.2010[1L],x.range.2010[2L],10);
y.wrap <- 16;
col.1973 <- '#3377BB';
col.2010 <- '#BBCCEE';
col.axis <- '#888888';
legend.x <- 0.77;
legend.y <- 0.2;
legend.overlap <- 0.01;
legend.spread <- 0.033;

## precompute derived parameters
h <- (1-ybararea.pct/100)/2*diff(ylim); ybararea.range <- c(ylim[1L]+h,ylim[2L]-h);
regions <- unique(df$region);
NB <- length(regions);
ybar.height.max <- diff(ybararea.range)/(NB + (NB-1L)/ybargap.ratio); ## this formula can be derived
ybar.height.2010 <- ybar.height.max;
ybar.height.1973 <- ybar.height.2010*ybar1973.pct/100;
ybar.centers <- rev(seq(ybararea.range[1L]+ybar.height.max/2,ybararea.range[2L]-ybar.height.max/2,len=NB));

## helper function
xscale <- function(x,r,xlim=c(0,1)) xlim[1L]+(x-r[1L])/diff(r)*diff(xlim);
## plot
par(mar=c(5,7,4,2)+0.1);
plot(NA,xlim=xlim,ylim=ylim,xaxs='i',yaxs='i',axes=F,ann=F);
## bars
with(df[df$year==2010L,],rect(xscale(0,x.range.2010),ybar.centers-ybar.height.2010/2,xscale(emissions,x.range.2010),ybar.centers+ybar.height.2010/2,col=col.2010,border=NA));
with(df[df$year==1973L,],rect(xscale(0,x.range.1973),ybar.centers-ybar.height.1973/2,xscale(emissions,x.range.1973),ybar.centers+ybar.height.1973/2,col=col.1973,border=NA));
## x-axes
segments(xlim[1L],ylim[1L],xlim[2L],col=col.axis);
axis(3L,xscale(x.ticks.1973,x.range.1973),x.ticks.1973,col=col.axis,padj=0.8);
mtext(expression(paste('Percentage of total ',CO[2],' emissions for 1973')),3L,1.75);
segments(xlim[1L],ylim[2L],xlim[2L],col=col.axis);
axis(1L,xscale(x.ticks.2010,x.range.2010),x.ticks.2010,col=col.axis,padj=-0.8);
mtext(expression(paste('Percentage of total ',CO[2],' emissions for 2010')),1L,1.75);
## y-axis
mtext(lapply(regions,function(x) paste(collapse='\n',strwrap(x,y.wrap))),2L,0.3,las=2L,at=ybar.centers);
## legend
rect(legend.x-legend.overlap,legend.y-ybar.height.2010/2,legend.x+legend.spread,legend.y+ybar.height.2010/2,col=col.2010,border=NA);
rect(legend.x-legend.spread,legend.y-ybar.height.1973/2,legend.x+legend.overlap,legend.y+ybar.height.1973/2,col=col.1973,border=NA);
text(legend.x-legend.spread,legend.y,'1973',pos=2L,offset=0.1);
text(legend.x+legend.spread,legend.y,'2010',pos=4L,offset=0.1);
References

