I generated a DecisionTree model from Pyspark and got the output like this:
print model._call_java('toDebugString')

  If (feature 26 <= 12.0)
   If (feature 40 <= 0.0)
    If (feature 16 <= 0.0)
     Predict: 0.0
    Else (feature 16 > 0.0)
     Predict: 1.0
   Else (feature 40 > 0.0)
    If (feature 39 <= 7.0)
     Predict: 1.0
    Else (feature 39 > 7.0)
     Predict: 0.0
  Else (feature 26 > 12.0)
   If (feature 40 <= 0.0)
    If (feature 25 <= 96.0)
     Predict: 0.0
    Else (feature 25 > 96.0)
     Predict: 0.0
   Else (feature 40 > 0.0)
    If (feature 28 <= 110.0)
     Predict: 0.0
    Else (feature 28 > 110.0)
     Predict: 0.0
I already parsed, in a very cumbersome way, the relation between feature 28 to the feature name:
def isint(s):
    try:
        int(s)
        return True
    except ValueError:
        return False
dd = {}
for i, col in enumerate(assembler.getInputCols()): dd.update({i:col.replace(' as bigint','')})

mytree = model.stages[2]._call_java('toDebugString')\
.replace('feature','')\
.replace('If (', '')\
.replace('Else (', '')\
.replace('Predict: 1.0', 'match')\
.replace('Predict: 0.0', 'no match')\
.replace(')','')

ff = []
for split in mytree.split(' '):
    if isint(split):
        ff.append(split)
feature_clean = list(set(ff[2:]))

mt = mytree.split('\n')
mt.pop(0)
mt = '\n'.join([t for t in mt])

for i in feature_clean:
    mt = mt.replace(' '+str(i),dd[int(i)])
print mt.replace('     ','')
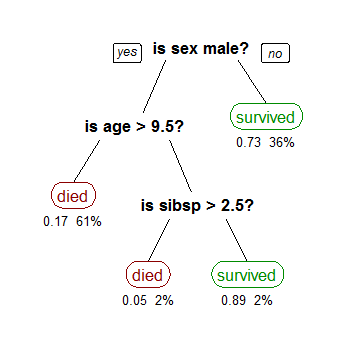
So at least I have the same structure with the feature names on them. I would like to generate a tree graph like this one. Is that possible without even more horrible parsing code?