I am working on a visualization of political books purchased together on Amazon using R and igraph. I've been able to get the network graph in a form that reveals the way certain books fall in a position indicating that they were not only purchased by people just buying other books with the same political point of view. Here's the graph:
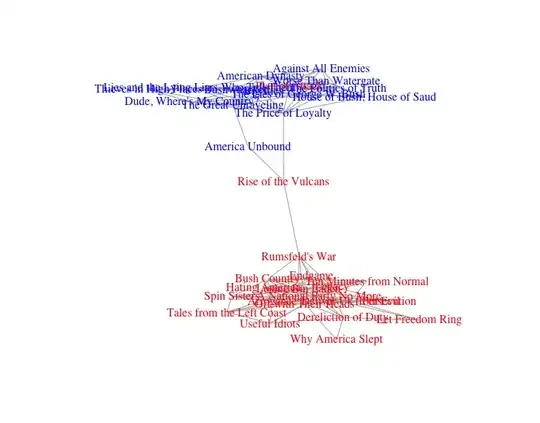
My problem is that with all those books in the tighter clusters, it's pretty impossible to read the labels. I'd like to expand those clusters if I could without obscuring the middle-position of the few titles linking the clusters.
Does anyone have any ideas about how I might get this done?
In order to generate this graph, I read in this data as a gml file and then did the following:
g<-read.graph("data/polbooks/polbooks.gml", format=c("gml"))
V(g)$degree <- degree(g, mode="all")
cut.off <- mean(V(g)$degree)
sub <- induced_subgraph(g, which(V(g)$degree>cut.off))
plot(sub, vertex.shape="none", vertex.size=1,
     vertex.label.color=ifelse(V(sub)$value=="l", "blue", "red"),
     layout=layout_with_fr)
I've tried several of the built-in layouts, but none of them really produce the desired result.
