I have been using advice on this thread Gantt charts with R
to develop something like this, this or this.
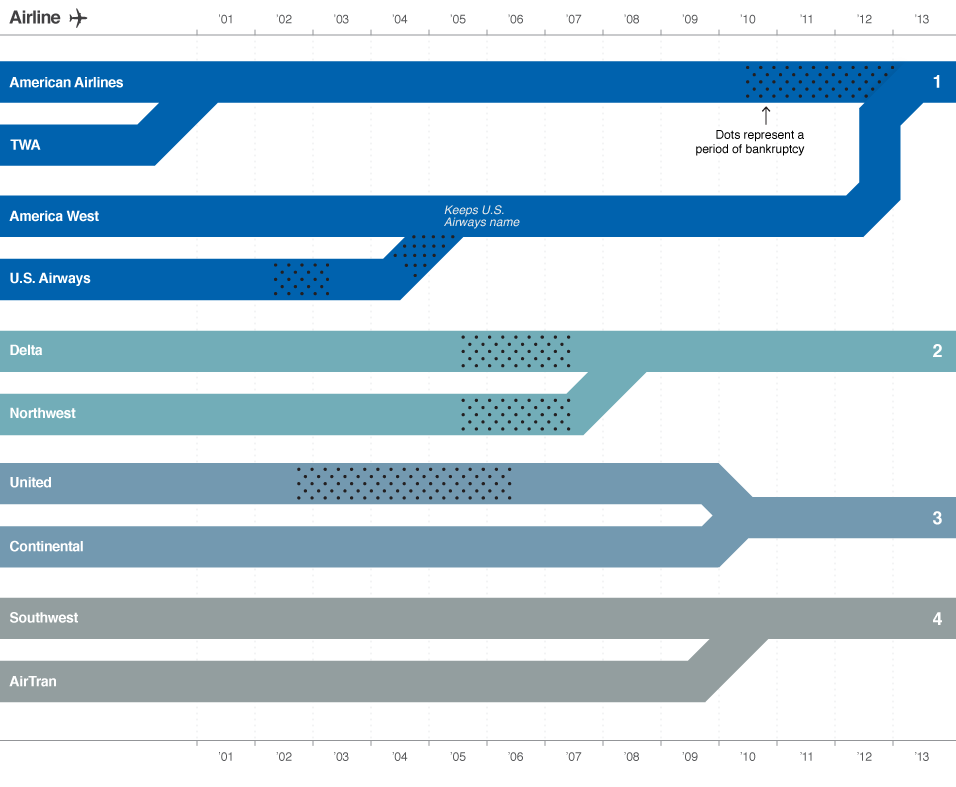
I have been failing miserably. I am not even certain on the data structure that I should follow. I believe the structure should look something like below:
start_date, end_date, ID_prior, ID_now, ID_post