42

I am developing an android application using Android Studio 2.1.3 and gradle.

The problem is that the breakpoint in a simple method is never hit, although it must be hit because the condition is met during application debugging.
First, I thought that the problem is related to the issue described in the answer for this question: BuildConfig.DEBUG always false when building library projects with gradle

To test this, I removed library project and integrated all my source code into the main app module. It solved nothing. To be noted that the following is the build.gradle, where minify is set to false for both debug/release:

apply plugin: 'com.android.application'  

android {  
    compileSdkVersion 23  
    buildToolsVersion "23.0.2"  
    defaultConfig {  
        applicationId "com.mycompany.mymobileapp"  
        minSdkVersion 21  
        targetSdkVersion 21  
        versionCode 1  
        versionName "1.0"  
    }  
    buildTypes {  
        release {  
            minifyEnabled false  
            proguardFiles getDefaultProguardFile('proguard-android.txt'), 'proguard-rules.pro'  
            debuggable true  
            jniDebuggable true  
            renderscriptDebuggable true  
            zipAlignEnabled false  
        }  
        debug {  
            debuggable true  
            minifyEnabled false  
            zipAlignEnabled false  
            jniDebuggable true  
            renderscriptDebuggable true  
        }  
    }  
    productFlavors {  
    }  
}  
  
dependencies {  
    compile fileTree(include: ['*.jar'], dir: 'libs')  
    testCompile 'junit:junit:4.12'  
    testCompile 'org.mockito:mockito-core:2.0.5-beta'  
    testCompile 'com.android.support:support-v4:23.1.1'  
    testCompile 'org.powermock:powermock-api-mockito:1.6.2'  
    testCompile 'org.powermock:powermock-module-junit4-rule-agent:1.6.2'  
    testCompile 'org.powermock:powermock-module-junit4-rule:1.6.2'  
    testCompile 'org.powermock:powermock-module-junit4:1.6.2'  
    compile 'com.android.support:appcompat-v7:23.1.1'  
}

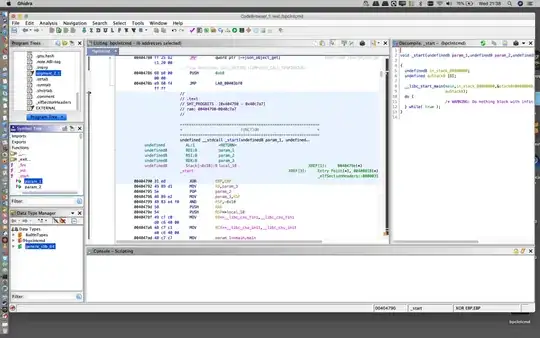
Here is the screenshot with what Android Studio shows to me:

No executable code found problem

This is also not the only case. It happens that the compiler, while Stepping over, jumps to completely another part of the code than the one being debugged.

Is there any reasonable explanation here? Suspend: "thread" and "all" tried, same result.

UPDATE 1: Re-created the project using Eclipse, and everything works fine. It is still amazing why using Android studio this does not work!

Community
  • 1
  • 1
XMight
  • 1,991
  • 2
  • 20
  • 36

12 Answers12

60
buildTypes {

release {
    minifyEnabled true
    shrinkResources true
    proguardFiles getDefaultProguardFile('proguard-android.txt')

}
debug {
    debuggable true
    minifyEnabled false
    proguardFiles getDefaultProguardFile('proguard-android.txt')

    }
}

Set minifyEnabled false in debug block in build.gradle file.

Tamir Abutbul
  • 7,301
  • 7
  • 25
  • 53
vinod
  • 1,126
  • 13
  • 18
8

After re-creating the application using Eclipse and observing the correct behavior, I returned to Android Studio in order to check if there is any option that I missed.

After trying all the options from File -> Settings that I could, I made the conclusion that Instant Run is the evil that caused me to waste so much precious time.

I don't understand how it is related with my problem, but after clearing all check-boxes:

enter image description here

I ended up with a code that executes the way I as a developer expect:

enter image description here

XMight
  • 1,991
  • 2
  • 20
  • 36
  • 1
    In my case it was happening all the time. You want to argue with C, C++, C# and Java many editors and 6 years experience and tell me that I don't know how to clean a project? Please don't write such useless comments anymore. Sadly I can't down-vote your comment. Also, this is not happening to me alone. Discussed with many other full-time Android developers after this and they have the instant instant run turned off by default because of bugs like this. – XMight Oct 30 '16 at 14:54
  • 2
    Enable Instant Run, clean project -> Result: breakpoint not hit. Disable Instant Run, clean project -> Result: breakpoint hit. Happens right now. I'm on a Windows 8.1 Pro Machine, maybe this is the problem. – XMight Oct 31 '16 at 16:01
  • Yes maybe platform related or version related I am on 2.2.2 and osx. I suggest you upgrade to 2.2.2. Here clean works always, but my build times with clean are terible on this computer. – Renetik Oct 31 '16 at 18:13
  • It did solve my problem. thank you for saving carbon foot prints :)) – Waterfr Villa Oct 20 '17 at 17:28
  • 1
    Cut(ctrl+X) the method and pasting somewhere else in the class worked for me.. Crazy:) – Akshatha S R Dec 08 '17 at 11:37
  • The `Instant run` option no longer exists in the latest Android Studio unfortunately. – andras Jan 19 '22 at 17:30
6

I was facing a similar issue.

I've tried:

  • Cleaning the Project
  • Resetting Android Studio
  • Rebuilding the project
  • Disabling the Instant Run

and it didn't work.

All I did in the end to make it work was Ctrl+Shift++. That is the shortcut for expanding all code blocks. I just ran the project after that and it worked.

Raza
  • 831
  • 9
  • 10
6

It`s problem with studio cache.
File -> Invalidate Caches / Restatrt... May help you.

user2183539
  • 246
  • 4
  • 5
2

try to clean and rebuild the project. try to make some log in this method to check if the it being executed.

LOG.(TAG,"method being executed")
Chenmin
  • 121
  • 7
  • Clean is good workaround but where is the bug report for this isssue, I should vote for fix ? I have to wait 4 mins after I hit clean thats not too much Instant Run. – Renetik Oct 28 '16 at 18:24
  • You may have inadvertently added code in that file since deploying it in the debugger, throwing off the line correlation. Clean and redeploy. – Lucy Apr 30 '21 at 09:14
2

I had the same problem as you did. I think that happened for some reason while I was cleaning up my code and I was collapsing some of my code blocks.

The solution was to use the shortcut CTRL + SHIFT + + to expand all of my code blocks and then to click File>Inavlidate Caches/Restart...

I am using Android Studio Arctic Fox | 2020.3.1 and build:gradle:4.1.3

Nikola
  • 21
  • 2
1

Uninstalling and installing the App on the test device solved my issue.

I tried:

  • Cleaning/rebuilding the Project
  • Resetting Android Studio, Clean Cache
  • Setting the debugger to stop on all threads
  • There is no minifyEnabled in my debug variant.

Disabling the Instant Run wasn't an option as of Android Studio 3.6 so I didn't try it. see this StackOverflow question

Richard Miller
  • 576
  • 1
  • 7
  • 18
1

In my case, the problem was Build Variants was set to release, which of course is not a debuggable build.

enter image description here

(I forgot about setting that previously to try profiling.)

Jerry101
  • 12,157
  • 5
  • 44
  • 63
1

Another reason why the breakpoint doesn't work might be, that you've placed it in a source code which is not used in runtime.

In my case, I work with multiple modules/dependencies. Therefore, if I want to place a breakpoint e.g. in RecyclerView, I have to take care which version will be used in runtime since Android Studio suggests all the available sources (press Ctrl+N two time).

enter image description here

Michal Vician
  • 2,486
  • 2
  • 28
  • 47
0

Restart Android Studio

If you know that nothing was changed that can cause this since it was working before. Then try by closing and restarting Android Studio. That worked for me on Android Studio 3.5.

Clean build did not work for me

HBB20
  • 2,743
  • 1
  • 24
  • 35
0

I was facing a similar issue.

add in your file build.gradle

DEV {
      initWith debug
    }
Devix
  • 432
  • 5
  • 16
-3

Make sure you don't misspell the file name and the class name.

neevek
  • 11,760
  • 8
  • 55
  • 73