1

I have some data that is displayed in a bar chart, using Google's Visualization API. Was simple enough until designers redesigned it... Now it appears to be something that is beyond what Google can help me with.

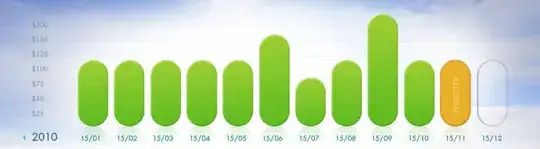
Given the attached mockup (and note the finer details like reflection and gradients!)- how would you go about building it? Using some existing graphing libraries? Homebrew from the ground up?

Thanks for any advice. alt text

rcourtna
  • 4,589
  • 5
  • 26
  • 27

3 Answers3

1

If you need to adhere to the custom design requirements as depicted in the image above, I would build a charting application using a more generalized graphics library such as Rapheal.

While it doesn't provide a simple API for plugging data into a chart, it does provide the ability to build a chart with the following:

chuckx
  • 6,484
  • 1
  • 22
  • 23
0

Ofcourse you can use chuckx recommendation of Rapheal which is a SVG based Javascript Library. It can accept JSON values so say if you have JSON from Google API you could feed in directly.

Option 2 : HTML Canvas. There are lot of HTML 5 canvas libraries like Kinect, fabric.js powerful javascript canvas libraries

Community
  • 1
  • 1
Ajax3.14
  • 1,647
  • 5
  • 24
  • 42
0

You can change the visual effect using CSS.