15

I'd like to programmatically create diagrams like this
(source: yaroslavvb.com)

I imagine I should use GraphPlot with VertexCoordinateRules, VertexRenderingFunction and EdgeRenderingFunction for the graphs. What should I use for colored beveled backgrounds?

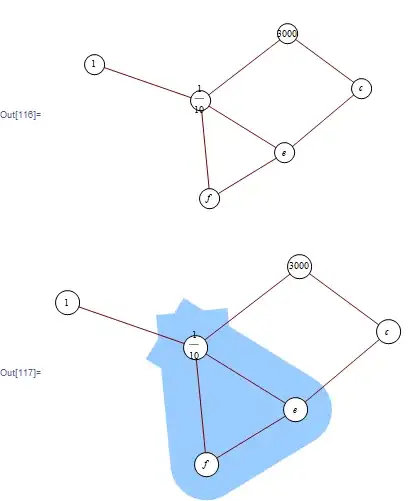
Edit Using mainly Simon's ideas, here's a simplified "less robust" version I ended up using

Needs["GraphUtilities`"];
GraphPlotHighlight[edges_, verts_, color_] := Module[{},
  vpos = Position[VertexList[edges], Alternatives @@ verts];
  coords = Extract[GraphCoordinates[edges], vpos];
  (* add .002 because end-cap disappears when segments are almost colinear *)  
  AppendTo[coords, First[coords] + .002];
  Show[Graphics[{color, CapForm["Round"], JoinForm["Round"], 
     Thickness[.2], Line[coords], Polygon[coords]}],
   GraphPlot[edges], ImageSize -> 150]
  ]

SetOptions[GraphPlot, 
  VertexRenderingFunction -> ({White, EdgeForm[Black], Disk[#, .15], 
      Black, Text[#2, #1]} &), 
  EdgeRenderingFunction -> ({Black, Line[#]} &)];
edges = GraphData[{"Grid", {3, 3}}, "EdgeRules"];
colors = {LightBlue, LightGreen, LightRed, LightMagenta};
vsets = {{8, 5, 2}, {7, 5, 8}, {9, 6, 3}, {8, 1, 2}};
MapThread[GraphPlotHighlight[edges, #1, #2] &, {vsets, colors}]


(source: yaroslavvb.com)

Glorfindel
  • 21,988
  • 13
  • 81
  • 109
Yaroslav Bulatov
  • 57,332
  • 22
  • 139
  • 197

3 Answers3

11

Generalising Samsdram's answer a bit, I get

GraphPlotHighlight[edges:{((_->_)|{_->_,_})..},hl:{___}:{},opts:OptionsPattern[]]:=Module[{verts,coords,g,sub},
  verts=Flatten[edges/.Rule->List]//.{a___,b_,c___,b_,d___}:>{a,b,c,d};
  g=GraphPlot[edges,FilterRules[{opts}, Options[GraphPlot]]];
  coords=VertexCoordinateRules/.Cases[g,HoldPattern[VertexCoordinateRules->_],2];
  sub=Flatten[Position[verts,_?(MemberQ[hl,#]&)]];
  coords=coords[[sub]];     
  Show[Graphics[{OptionValue[HighlightColor],CapForm["Round"],JoinForm["Round"],Thickness[OptionValue[HighlightThickness]],Line[AppendTo[coords,First[coords]]],Polygon[coords]}],g]
]
Protect[HighlightColor,HighlightThickness];
Options[GraphPlotHighlight]=Join[Options[GraphPlot],{HighlightColor->LightBlue,HighlightThickness->.15}];

Some of the code above could be made a little more robust, but it works:

GraphPlotHighlight[{b->c,a->b,c->a,e->c},{b,c,e},VertexLabeling->True,HighlightColor->LightRed,HighlightThickness->.1,VertexRenderingFunction -> ({White, EdgeForm[Black], Disk[#, .06], 
Black, Text[#2, #1]} &)]

Mathematica graphics


EDIT #1: A cleaned up version of this code can be found at http://gist.github.com/663438

EDIT #2: As discussed in the comments below, the pattern that my edges must match is a list of edge rules with optional labels. This is slightly less general than what is used by the GraphPlot function (and by the version in the above gist) where the edge rules are also allowed to be wrapped in a Tooltip.

To find the exact pattern used by GraphPlot I repeatedly used Unprotect[fn];ClearAttributes[fn,ReadProtected];Information[fn] where fn is the object of interest until I found that it used the following (cleaned up) function:

Network`GraphPlot`RuleListGraphQ[x_] := 
  ListQ[x] && Length[x] > 0 && 
    And@@Map[Head[#1] === Rule 
         || (ListQ[#1] && Length[#1] == 2 && Head[#1[[1]]] === Rule) 
         || (Head[#1] === Tooltip && Length[#1] == 2 && Head[#1[[1]]] === Rule)&, 
      x, {1}]

I think that my edges:{((_ -> _) | (List|Tooltip)[_ -> _, _])..} pattern is equivalent and more concise...

Sjoerd C. de Vries
  • 16,122
  • 3
  • 42
  • 94
Simon
  • 14,631
  • 4
  • 41
  • 101
  • what are you trying to match with "edges" pattern? – Yaroslav Bulatov Nov 04 '10 at 08:14
  • The order of the vertices in the `GraphicsComplex` generated by `GraphPlot` is simply the order that they occur in `edges`. My `verts=...` is just an ugly way of getting that list of vertices in the order that they occur so that I know which coordinates to extract from `g` and pass to the `Graphics` command. It's a kludge necessitated by the fact that if `VertexLabeling->False` then GraphPlot doesn't keep any information about which vertex is which. – Simon Nov 04 '10 at 08:21
  • ic...it seems you can get around that with VertexList/GraphCoordinates. I was actually asking about edges: pattern in function definition. For instance, it matches {3 -> 4, 4 -> 5, {6 -> 7, 2}} – Yaroslav Bulatov Nov 04 '10 at 08:41
  • @Yaroslav I didn't know about VertexList -- that is a lot neater. As for the pattern, that's the same pattern the GraphPlot uses when plotting a list of edges (as opposed to an adjacency matrix). – Simon Nov 04 '10 at 10:17
  • How can you tell that's the pattern they use? – Yaroslav Bulatov Nov 04 '10 at 18:13
  • @Yaroslav I can't... but it does the same thing as what's described in the documentation. (of course, correct me if I'm wrong) – Simon Nov 04 '10 at 22:17
  • ah, I see, so it's for edges with optional label – Yaroslav Bulatov Nov 04 '10 at 22:25
  • Yep, edges with optional labels. Actually, a bit of digging and you find that Mma uses the check: `Network`GraphPlot`RuleListGraphQ[x_]:=!Network`GraphPlotDump`Private`bigMatrixQ[x]&&ListQ[x]&&Length[x]>0&&And@@Map[Head[#1]===Rule||(ListQ[#1]&&Length[#1]==2&&Head[#1[[1]]]===Rule)||(Head[#1]===Tooltip&&Length[#1]==2&&Head[#1[[1]]]===Rule)&,x,{1}]` which is slightly more general than mine, since it allows for the `Rule`s to be wrapped in `Tooltip`s. – Simon Nov 04 '10 at 22:25
  • 2
    @Yaroslav 3 steps (sorry about the mess...) (1)`Unprotect[GraphPlot];ClearAttributes[GraphPlot,ReadProtected];Information[GraphPlot]` (2)`Unprotect[Network`GraphPlotDump`Private`RuleListGraphQ];ClearAttributes[Network`GraphPlotDump`Private`RuleListGraphQ,ReadProtected];Information[Network`GraphPlotDump`Private`RuleListGraphQ]` (3)`Unprotect[Network`GraphPlot`RuleListGraphQ];ClearAttributes[Network`GraphPlot`RuleListGraphQ,ReadProtected];Information[Network`GraphPlot`RuleListGraphQ]` – Simon Nov 05 '10 at 05:33
  • @Simon Your last two comments are very interesting! Could you edit your answer and include them? Here, in the comments, they are almost hidden for future readers, and I guess it took you a lot of effort to dig that out. – Dr. belisarius Nov 20 '10 at 04:26
  • @belisarius Thanks. It's not really part of my answer -- but you are right, these things do get lost in the comments. I've edited my answer. – Simon Nov 20 '10 at 07:45
5

For simple examples where you are only connecting two nodes (like your example on the far right), you can draw lines with capped end points like this.

vertices = {a, b};
Coordinates = {{0, 0}, {1, 1}};
GraphPlot[{a -> b}, VertexLabeling -> True, 
 VertexCoordinateRules -> 
  MapThread[#1 -> #2 &, {vertices, Coordinates}], 
 Prolog -> {Blue, CapForm["Round"], Thickness[.1], Line[Coordinates]}]

Mathematica graphics

For more complex examples (like second from the right) I would recommend drawing a polygon using the vertex coordinates and then tracing the edge of the polygon with a capped line. I couldn't find a way to add a beveled edge directly to a polygon. When tracing the perimeter of the polygon you need to add the coordinate of the first vertex to the end of the line segment that the line makes the complete perimeter of the polygon. Also, there are two separate graphics directives for lines CapForm, which dictates whether to bevel the ends of the line, and JoinForm, which dictates whether to bevel the intermediate points of the line.

vertices = {a, b, c};
Coordinates = {{0, 0}, {1, 1}, {1, -1}};
GraphPlot[{a -> b, b -> c, c -> a}, VertexLabeling -> True, 
 VertexCoordinateRules -> 
  MapThread[#1 -> #2 &, {vertices, Coordinates}], 
 Prolog -> {Blue, CapForm["Round"], JoinForm["Round"], Thickness[.15],
    Line[AppendTo[Coordinates, First[Coordinates]]], 
   Polygon[Coordinates]}]

Mathematica graphics

Sjoerd C. de Vries
  • 16,122
  • 3
  • 42
  • 94
Samsdram
  • 1,615
  • 15
  • 18
4

JoinForm["Round"] will round the joins of line segments.

You'll want a filled polygon around the centers of the vertices in the colored region, then a JoinForm["Round"], ..., Line[{...}] to get the rounded corners.

Consider

foo = GraphPlot[{a -> b, a -> c, b -> d, b -> e, b -> f, c -> e, e -> f}, 
    VertexRenderingFunction -> 
    ({White, EdgeForm[Black], Disk[#, .1], Black, Text[#2, #1]} &)]
Show[
    Graphics[{
      RGBColor[0.6, 0.8, 1, 1],
      Polygon[foo[[1, 1, 1, 1, 1, {2, 5, 6, 2}]]],
      JoinForm["Round"], Thickness[0.2],
      Line[foo[[1, 1, 1, 1, 1, {2, 5, 6, 2}]]]
    }],
    foo
]
Mathematica graphics

where foo[[1,1,1,1,1]] is the list of vertex centers and {2,5,6} pulls out the {b,e,f} vertices. ({2,5,6,2} closes the line back at its starting point.)

There's plenty of room for prettifying, but I think this covers the ingredient you didn't mention above.

Sjoerd C. de Vries
  • 16,122
  • 3
  • 42
  • 94
Eric Towers
  • 4,175
  • 1
  • 15
  • 17