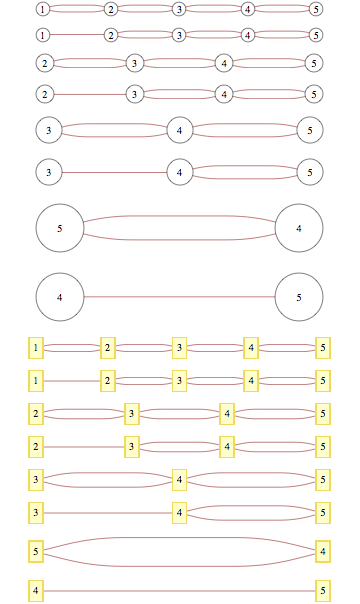
I'm having problem with custom VertexRenderingFunction showing at different sizes for different graphs. An example is below, the default vertex rendering function has the desired behavior since vertices look the same in all graphs, any suggestion how to achieve that with custom vertices?

(source: yaroslavvb.com)
edges = Most[
    ArrayRules[GraphData[{"Path", 5}, "AdjacencyMatrix"]]][[All, 1]];
doit[vrf_] :=
  Print /@ Table[
    GraphPlot[Rule @@@ edges[[k ;;]], VertexRenderingFunction -> vrf,
     VertexLabeling -> True], {k, 1, Length[edges]}];
doit[({White, EdgeForm[Black], Disk[#, .1], Black, Text[#2, #1]} &)];
doit[Automatic];
Update, 1 hour later:
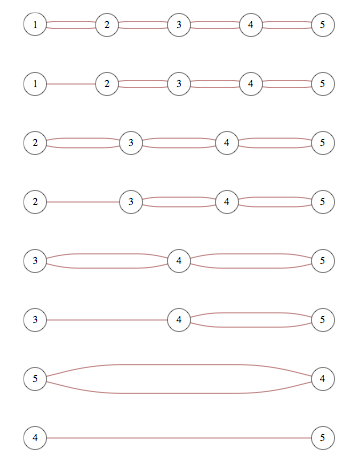
Michael Pilat as usual gives the solution, here's what it looks like with
(Inset[Graphics[{White, EdgeForm[Black], Disk[{0, 0}, .05], Black,
     Text[#2, {0, 0}]}, ImageSize -> 25], #] &)
for rendering function

(source: yaroslavvb.com)
