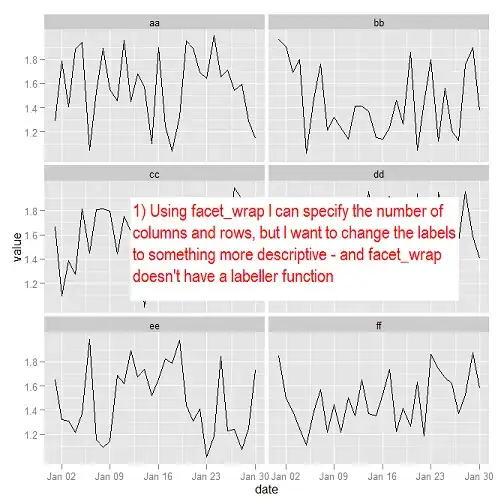
I have a lot of data like this
 callr |    method  | call_count |    day
 ------+-------------------------+------------
 foo   | find_paths |      10    | 2016-10-10
 bar   | find_paths |      100   | 2016-10-10
 foo   | find_all   |      123   | 2016-10-10
 foo   | list_paths |     2243   | 2016-10-10
 foo   | find_paths |      234   | 2016-10-11
 foo   | collect    |      200   | 2016-10-11
 bar   | collect    |       1    | 2016-10-11
 baz   | collect    |        3   | 2016-10-11
 ...      ...             ...        ...
And I want to create a stacked histogram for each method showing continuous days along the bottom and stacked bars for each day with callers and number of calls.
If I transform the data, e.g.
select method, sum(call_count), day from foo where method='collect' group by method, day order by method, day;
I'm able to get a bar chart with all the calls for one method in one color, with a plg file like this, e.g.:
set terminal png
set title "Method: " . first_arg
set output "" . first_arg . ".png"
set datafile separator '|'
set style data boxes
set style fill solid
set boxwidth 0.5
set xdata time
set timefmt "%Y-%m-%d"
set format x "%a %m-%d"
xstart="2016-10-01"
xend="2017-01-01"
set xrange [xstart:xend]
set xlabel "Date" tc ls 8  offset -35, -3
set ylabel "Calls"  tc ls 8

plot '<cat' using 3:4
called like this:
cat file | gnuplot -p -e "plot '<cat';first_arg='collect'" calls.plg
However, what I really want is a way to show the breakdown by caller in the same sort of graph. I can't get the stacked histogram using gnuplot yet. Everything I've tried complains about the using statement, e.g. 'Need full using spec for x time data' or the like.
Want something like this, but with the days continuous along the bottom. E.g. if no calls were made that day - then no histogram bar
Thank you for any ideas


