1

I am trying to display images that are generated by Tensorflow directly in Tensorboard. I tried to use this solution Tensorflow: How to Display Custom Images in Tensorboard (e.g. Matplotlib Plots) but I don't get how you could link this to images generated during training as the summary is defined before creating the Tensorflow graph:

def plot(samples):
   fig = plt.figure(figsize=(4, 4))
   gs = gridspec.GridSpec(4, 4)
   gs.update(wspace=0.05, hspace=0.05)
   for i, sample in enumerate(samples):
       ax = plt.subplot(gs[i])
       plt.axis('off')
       ax.set_xticklabels([])
       ax.set_yticklabels([])
       ax.set_aspect('equal')
       plt.imshow(sample.reshape(28, 28), cmap='Greys_r')
   return fig

   # ....

   if it % 1000 == 0:
       samples = sess.run(G_sample, feed_dict={z: sample_z(16, z_dim)})
       fig = plot(samples)
       plt.savefig('out/{}.png'
                    .format(str(i).zfill(3)), bbox_inches='tight')
       i += 1
       plt.close(fig)
Amine Kerkeni
  • 914
  • 3
  • 14
  • 29

2 Answers2

1

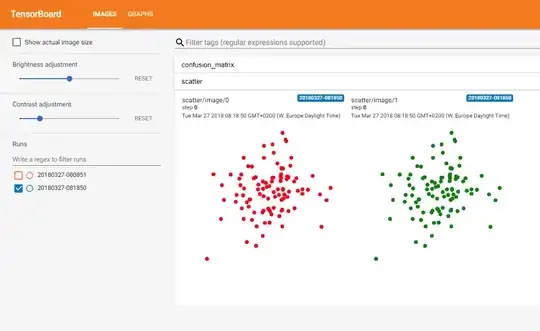
With tf-matplotlib a simple scatter plot boils down to:

import tensorflow as tf
import numpy as np

import tfmpl

@tfmpl.figure_tensor
def draw_scatter(scaled, colors): 
    '''Draw scatter plots. One for each color.'''  
    figs = tfmpl.create_figures(len(colors), figsize=(4,4))
    for idx, f in enumerate(figs):
        ax = f.add_subplot(111)
        ax.axis('off')
        ax.scatter(scaled[:, 0], scaled[:, 1], c=colors[idx])
        f.tight_layout()

    return figs

with tf.Session(graph=tf.Graph()) as sess:

    # A point cloud that can be scaled by the user
    points = tf.constant(
        np.random.normal(loc=0.0, scale=1.0, size=(100, 2)).astype(np.float32)
    )
    scale = tf.placeholder(tf.float32)        
    scaled = points*scale

    # Note, `scaled` above is a tensor. Its being passed `draw_scatter` below. 
    # However, when `draw_scatter` is invoked, the tensor will be evaluated and a
    # numpy array representing its content is provided.   
    image_tensor = draw_scatter(scaled, ['r', 'g'])
    image_summary = tf.summary.image('scatter', image_tensor)      
    all_summaries = tf.summary.merge_all() 

    writer = tf.summary.FileWriter('log', sess.graph)
    summary = sess.run(all_summaries, feed_dict={scale: 2.})
    writer.add_summary(summary, global_step=0)

When executed, this results in the following plot inside Tensorboard

chrish.
  • 715
  • 5
  • 11
0

I think you are confusing two things: Tensorboard summaries (https://www.tensorflow.org/api_docs/python/tf/summary/image) and saving an image.

If you want to display your samples in tensorboard, you have to use tf.summary.image in your code and feed it your G_sample tensor. If you look at https://www.tensorflow.org/api_guides/python/summary#Generation_of_Summaries you get more information about how you can use Filewriters etc.

Let me know if this helps, or you get stuck somewhere else!

rmeertens
  • 4,383
  • 3
  • 17
  • 42
  • 1
    My problem is that I don't get how I could convert my data to the image summary format without going through matplotlib. I want to replace the plt.savefig with somthing that pushes the result to tensorboard. I am already able to show scalar summaries in tensorboard. with the same example. – Amine Kerkeni Feb 19 '17 at 16:44