14

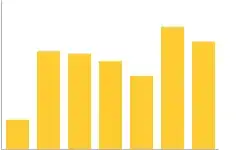
I'm wondering why google charts add a blank padding when not specifying the top/right/left axises.

alt text

Select the image and you'll find a huge padding except the bottom which is already filled & that's why, how to remove that?

Specifically, Talking about the right and left paddings.

Thank you.

CodeOverload
  • 47,274
  • 54
  • 131
  • 219

3 Answers3

20

You can use the chartArea option as follows:

options.chartArea = { left: '8%', top: '8%', width: "70%", height: "70%"};

More documentation can be viewed here:

https://developers.google.com/chart/interactive/docs/gallery/piechart#Configuration_Options

WJA
  • 6,676
  • 16
  • 85
  • 152
CodeToad
  • 4,656
  • 6
  • 41
  • 53
3

When using the Google Chart API you can eliminate the padding. I made an example Here.

The relevant parameter is chma.

According to the documentation:

You can specify the size of the chart's margins, in pixels. Margins are calculated inward from the specified chart size (chs); increasing the margin size does not increase the total chart size, but rather shrinks the chart area, if necessary.

You can try these parameters online in the Chart Playground HERE.

HTH!

alt text

Edit: Warning from Google

Important: The Image Charts portion of Google Chart Tools has been officially deprecated as of April 20, 2012. It will continue to work as per our deprecation policy.

Community
  • 1
  • 1
Dr. belisarius
  • 60,527
  • 15
  • 115
  • 190
  • 3
    chma is now deprecated, for a 2012 answer to this question see http://stackoverflow.com/questions/9661456/remove-padding-or-margins-from-google-charts – Josh Diehl May 05 '12 at 16:51
2

Unfortunately, as said in Chart Margins documentation you can set only the minimum margin on each side of the chart.

Google adds some unnecessary margin (mostly on top) itself and there is no parameter which can stop this behavior.

Petr Peller
  • 8,581
  • 10
  • 49
  • 66