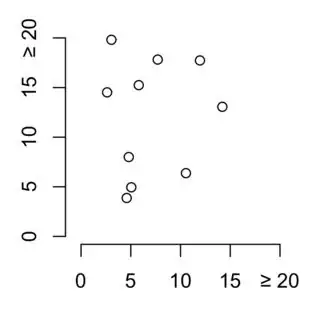
I am trying to create a plot where in the axis labels, the largest value includes a greater-than-or-equals symbol.
I found that I can do this easily enough with unicode:
xy <- cbind(runif(10, 0, 20), runif(10, 0, 20))

plot.new()
plot.window(xlim = c(0, 20), ylim = c(0,20))
points(xy)

axisLabels <- seq(0, 20, by = 5)

# add >= symbol to top axis label with unicode
axisLabels <- as.character(axisLabels)
axisLabels[5] <- paste('\u2265', axisLabels[5])


axis(1, at = seq(0, 20, by = 5), labels = axisLabels)
axis(2, at = seq(0, 20, by = 5), labels = axisLabels)
... however this does not seem to work when you export the graphic to pdf.
How can I do this with expression or bquote, or something else altogether? I've used these functions before, but can't figure out what to do when I only want to apply it to one element in my labels vector.
Ultimately, this code will be part of an R package, therefore I'm looking for a solution that will work for users, who would probably expect that they can save their plot from R as a pdf.
I am specifically looking for a solution that involves passing variables rather than specific numbers to the axis labels argument, and also a solution that does not need special treatment when a user tries to save the plot to pdf.
