Here's one way
# Plotting 3D maps using OpenStreetMap and RGL. For info see:
# http://geotheory.co.uk/blog/2013/04/26/plotting-3d-maps-with-rgl/
map3d <- function(map, ...){
if(length(map$tiles)!=1){stop("multiple tiles not implemented") }
nx = map$tiles[[1]]$xres
ny = map$tiles[[1]]$yres
xmin = map$tiles[[1]]$bbox$p1[1]
xmax = map$tiles[[1]]$bbox$p2[1]
ymin = map$tiles[[1]]$bbox$p1[2]
ymax = map$tiles[[1]]$bbox$p2[2]
xc = seq(xmin,xmax,len=ny)
yc = seq(ymin,ymax,len=nx)
colours = matrix(map$tiles[[1]]$colorData,ny,nx)
m = matrix(0,ny,nx)
surface3d(xc,yc,m,col=colours, ...)
return(list(xc=xc, yc=yc, colours=colours))
}
require(rgl)
require(OpenStreetMap)
map <- openproj(openmap(c(52.5227,13.2974),c(52.4329,13.5669), zoom = 10))
set.seed(1)
n <- 30
bbox <- unlist(map$bbox, use.names = F)
x <- do.call(runif, c(list(n), as.list(bbox[c(1,3)])))
y <- do.call(runif, c(list(n), as.list(bbox[c(4,2)])))
z <- runif(n, 0, .1)
m <- rbind(cbind(x,y,z=0), cbind(x,y,z))
m <- m[as.vector(mapply(c, 1:n, (n+1):(2*n))),]
open3d(windowRect=c(100,100,800,600))
coords <- map3d(map, lit=F)
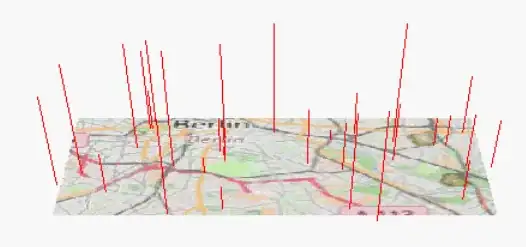
segments3d(m, col="red", add=T)
which gives you something like:

And another way, which you can extend to use box3D to maybe make it more look like your example:
library(plot3D)
with(coords, {
  image3D(
    z = 0, x = xc, y = yc, colvar = colours, zlim = c(0,max(z)),
    scale=F, theta = 0, bty="n")
  segments3D(x,y,rep(0,length(x)),x,y,z, col="red", add=T)
})

