1

My data looks like this:

  type  age  count
0    A    4      2
1    A    5      1
2    B    4      1

I want to get a Bokeh HeatMap like this out from it. Yet I get

C:\Users\panda\Anaconda3\lib\site-packages\bokeh\charts\stats.py in binstr_to_list(bins)
    197     def binstr_to_list(bins):
    198         """Produce a consistent display of a bin of data."""
--> 199         value_chunks = bins.split(',')
    200         value_chunks = [val.replace('[', '').replace(']', '').replace('(', '').replace(')', '') for val in value_chunks]
    201         bin_values = [float(value) for value in value_chunks]

AttributeError: 'pandas._libs.interval.Interval' object has no attribute 'split'

To get it I added to data creation:

HeatMap(ages, x='type', y='age', values='count')
DuckQueen
  • 772
  • 10
  • 62
  • 134

1 Answers1

0

The bokeh.charts API including HeatMap was deprecated and removed entirely some time ago. Instead, the stable and supported bokeh.plotting API can be used. There are complete examples of heat maps in the main documentation section on Handling Categorical Data.

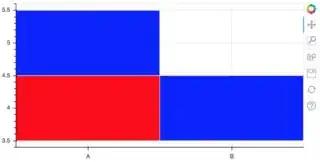
Here is a simplifed version of your code:

from bokeh.plotting import figure, show

p = figure(x_range=('A', 'B'), plot_height=300)

types = ['A', 'A', 'B']
ages = [4, 5, 4]
colors = ['red', 'blue', 'blue'] # map of age = [2, 1, 1]

p.rect(x=types, y=ages, width=1, height=1, fill_color=colors, line_color="white")

show(p)

enter image description here

For real code you might consider using a color mapper to shade each rect in the browser based on some other data column.

bigreddot
  • 33,642
  • 5
  • 69
  • 122