1

I'm creating logs using Apple's os.log framework. I'm just making logs like:

os_log("Update: Lat: %{public}f | Long:  %{private}f | RemainingTime: %{public}f ", log: log, type: .default, location.coordinate.latitude, location.coordinate.longitude, UIApplication.shared.backgroundTimeRemaining).

I do see the logs in console & debugger.

I've read this and I'm successfully able to download the container (just not sure if the container contains what I'm looking for or if this is the correct place to look at). Then I click on Show packages:

But after that I only see:

enter image description here

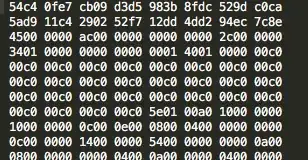
I looked into all files. The files just contained numbers like:

enter image description here

Should I be doing something extra or I'm looking in the wrong place?


EDIT1: After JAL's suggestion:

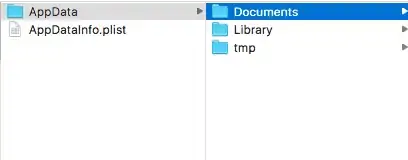
I looked into (Documents, Library, tmp). There are plist and ktx files. and function.data & map.data file.

I looked into these files:

enter image description here

and also these files:

enter image description here

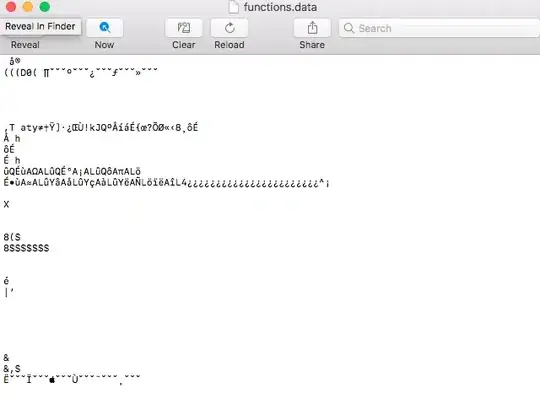
I tried opening them with console but I get gibberish results like the image below:

enter image description here


EDIT2:

so first I didn't have permission to open /var/db/diagnostics, I had to do sudo bash. Then I did cd /var/db/diagnostics and saw these files.

Events
FaultsAndErrors
Oversize
SpecialHandling
StateDumps
TTL
logdata.Persistent.20170724T212501.tracev3
logdata.Persistent.20170725T015616.tracev3
logdata.Persistent.20170725T134017.tracev3
logdata.Persistent.20170725T171020.tracev3
logdata.Persistent.20170725T213354.tracev3
logdata.Persistent.20170726T002702.tracev3
logdata.Persistent.20170726T144412.tracev3
logdata.Persistent.20170726T202128.tracev3
logdata.Persistent.20170727T021506.tracev3
logdata.Persistent.20170727T033929.tracev3
logdata.Persistent.20170727T075325.tracev3
logdata.Persistent.20170727T145233.tracev3
logdata.statistics.0.txt
logdata.statistics.1.txt
shutdown.log

Then I did open -a console logdata.Persistent.20170725T015616.tracev3 (I tried other .tracev3 files as well), but the console just opens and starts tracking realtime as if I just opened console normally...
mfaani
  • 33,269
  • 19
  • 164
  • 293

2 Answers2

6

You did not specify iOS, macOS, or tvOS in your question, so I am keeping my answer generic across all platforms.

Review WWDC 2016 - Session 721 - Unified Logging and Activity Tracing.

Logging data is stored in a new compressed binary format (.tracev3 or .logarchive files), that's what those "numbers" are. You must use Console.app or the log command line tool to open these files.

You're looking in the wrong place for the log files. From the session video:

Those files are now stored under /var/db/diagnostics with additional supporting files in /var/db/uuidtext. There are new tools to access that data, there's a new Console, a new log command line tool and one of the things you have to keep in mind is because the data is now stored in a binary format you must use the new tools to access it. So you can no longer grep through logs you have to use our tools to do the surfing through it.

There's also another new type of file the .logarchive, which is there for portability of log data. Essentially a .logarchive is a collection of information out of /var/db/diagnostics and you uuidtext collected together into a single file that's easier to transfer to email, to attach to bug reports and the like.

If you redirect stdout or stderr to a file (such as the code in this example), it should be in the Documents directory of your application's sandbox (or whatever directory you specified). Logs written to /var/db/diagnostics are generally unavailable to end users on iOS and tvOS.

Community
  • 1
  • 1
JAL
  • 41,701
  • 23
  • 172
  • 300
  • @Honey The same should apply for any platform. Try to open those files in the Console.app and see if you can read them. – JAL Jul 27 '17 at 16:55
  • @Honey What? Those are not log files, it looks like they are 3D texture files or Metal supporting files. You are definitely looking in the wrong place. – JAL Jul 27 '17 at 17:13
  • @Honey did you look at the link I provided in my answer? The log directory is right there. I added it to my question. – JAL Jul 27 '17 at 17:18
  • ok, so I think I haven't correctly followed the steps necessary to download the file, I'm guessing 1. I have do [this](https://stackoverflow.com/a/41741076/5175709) to create a log file in my document directory right? 2. On the Xcode organizer >> click device >> click gear button >> download container. Right? – mfaani Jul 27 '17 at 17:19
  • @Honey no, the container directory is not `/var/db/diagnostics`. – JAL Jul 27 '17 at 17:21
  • What is the file name of your log file? Do you see it in your Documents directory after creating it? If you specify an output file in your application's sandbox, it should be in the documents directory, which is in the container, not in var. – JAL Jul 27 '17 at 17:35
  • Let us [continue this discussion in chat](http://chat.stackoverflow.com/rooms/150343/discussion-between-honey-and-jal). – mfaani Jul 27 '17 at 17:46
  • so once I dump that code in my didFinish...It no longer shows in neither console or Xcode's debugger. I'm only able to download from app Container (as mentioned in my own answer). Is that expected? Is there any way to be to do both? (I removed my previous comment, because I didn't explain well what happened) – mfaani Aug 01 '17 at 16:34
  • @Honey You're redirecting stderr in that context. I'll have to see if there's a way to get the log output to go to both the console and a separate file. – JAL Aug 01 '17 at 16:38
  • I'm guessing that you can't change from where the console reads...nor you can download logs *directly* from where 'console' reads. So you must have it in 2 difference places which will impact performance. right? – mfaani Aug 01 '17 at 16:40
  • _You're redirecting stderr in that context. I'll have to see if there's a way to get the log output to go to both the console and a separate file._ did you find an answer to this? – mfaani Dec 13 '18 at 16:55
  • @Honey Hey, sorry for the delay, haven't thought about this answer in over a year. I believe the only way to view these logs without Console.app is to capture a sysdiagnose on the device and use the `log` command line utility to unarchive the logs on iOS or tvOS. On macOS you can still capture a sysdiagnose but I believe they're also written to `/var/db/diagnostics`. – JAL Dec 14 '18 at 21:04
  • I actually did get a sysdiagnose. But you don't need to view it through the command line...See my edited answer below. – mfaani Dec 14 '18 at 21:19
  • I'm aware of that. `logarchive`s can be opened using the `log` command line tool or via Console.app. Your question explicitly asks "without console.app" – JAL Dec 14 '18 at 21:20
  • I just made an edit to the question to clarify that. – mfaani Dec 14 '18 at 21:23
  • Great! I also now have a better understanding of `os_log` and ASL. I started at Apple in September and deal with these types of logs on a daily basis. Your best bet as a 3rd party dev is to use Console.app to stream the logs, or capture a sysdiagnose and use `log show --info --debug system.log_archive`. – JAL Dec 14 '18 at 21:25
  • Check out `--predicate` as well to search the logs if you use `log show`. – JAL Dec 14 '18 at 21:27
  • The command you sent is peculiarly backwards :) The correct version of it is: `log show system_logs.logarchive --info --debug` – mfaani Dec 14 '18 at 21:47
  • Ha, i think order doesn’t matter, that was just a sample. – JAL Dec 14 '18 at 21:49
  • So you're not aware of any workaround where I can just email the OSLogs without creating something as heavy as 200MBs? :/ FWIW I'm working on an enterprise application so I'm not bound by app store. The only thing that is holding the team back is the inability to email OSLog logs – mfaani Dec 14 '18 at 21:53
  • No public workarounds unfortunately. You might need to create your own logging interface and write the messages to disk yourself. – JAL Dec 14 '18 at 22:15
  • But I would highly suggest filing a radar asking for this enhancement. – JAL Dec 14 '18 at 22:15
  • Let us [continue this discussion in chat](https://chat.stackoverflow.com/rooms/185272/discussion-between-honey-and-jal). – mfaani Dec 14 '18 at 22:27
5

OptionA: Retrieve logs remotely without any specific setup.

  • trigger a sysdianose.
  • use Airdrop and share the sysdiagnose to your mac
  • unarchive the sysdiagnose file. It will look like this:

enter image description here

  • open the system_logs.logarchive with Console.app
  • it will be as if you're connected to the Console.app. You can filter by subsystem, log level, category and time. It will look like this:

enter image description here

Note: Searching and filtering is quite slow. Sometimes it takes 2 minutes. It might help if you filter out the dates you don't care about. You can do that by using the filer at the bottom. You have to wait until the loading archive spinner at the bottom right is done loading

OptionB: Redirect them to be stored in your App Sandbox

After following the suggestions of this answer I was able to redirect the logs into the documents directory for my app's sandbox, then I was able to download my container/sandbox using this answer.

Once I clicked on show package contents I had this:

enter image description here

I opened the log files using console and the results I got were:

enter image description here

The Longitude should have showed up as private but since I had it ran through Xcode ie debug mode still the field was rendered public.


mfaani
  • 33,269
  • 19
  • 164
  • 293
  • Useful addition. I sure wouldn’t have thought of that! – matt Dec 14 '18 at 21:21
  • @Honey While using `freopen` can help us to navigate all the log from console into specific file path, it ONLY works while we are debugging with XCode. If you only run app, the output file will be empty... – nahung89 Mar 12 '20 at 08:26