0

Say you have a vector, and you make a barplot of it in R. How do you calculate the centroid / center of gravity of the barplot?

x<-cumsum(rnorm(50,1,2)) 
par(mfrow=c(1,2))
plot(x,type="l")
barplot(x)
par(mfrow=c(1,1))

There are plenty of answers on here about the center of gravity of a polygon, but I'm not sure which points I need to get the entire shape of the barplot, and not just the vector with the points (like in the left plot).

MisterH
  • 135
  • 1
  • 7

2 Answers2

2

You can easily compute it using this function

getCentroid <- function(x, width = 1) {
  A  <- x * width                  # area of each bar
  xc <- seq(width/2, length(x), 1) # x coordinates of center of bars
  yc <- x/2                        # y coordinatey

  cx <- sum(xc * A) / sum(A)
  cy <- sum(yc * A) / sum(A)
  return(list(x = cx, y = cy))
}
points(getCentroid(x), col = 'red', pch = 19)

Notes: The default width of each bar is 1. The x coordinate of the centroid of two bars can be computed using the formula

enter image description here

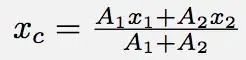
The same applies to the y coordinate. This can be extended to a higher number of bars.

enter image description here


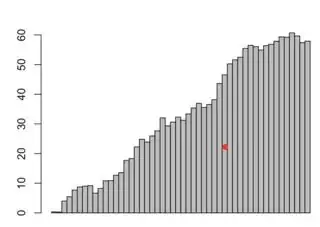
Since we do not have a perfect triangle, there will always be an error if we compare the centroids. Taking bars with the same height difference for example, like

x <- seq(0, 1, length.out = 1000)

(where the first bar has heigth 0) will always yield an error in the x coordinate of 1/6 (2000/3 compared to 666.83333) . The reason is the missing area due to the fact that we have no perfect triangle. This missing area equals 0.5 (Think about the height difference and multiply it by the bar width. Summing this over all bars and dividing it by 2 equals....).

Martin Schmelzer
  • 23,283
  • 6
  • 73
  • 98
1

Centroid of every bar is in its geometric center, so you can use approach for "A_system_of_particles".

M = Sum(Height[i])        for all i
cx = Sum(Height[i] * i) / M 
cy = Sum(Height[i] * Height[i] / 2) / M 
MBo
  • 77,366
  • 5
  • 53
  • 86
  • Hi MBo, I meant the COG of the entire plot, not of every bar individually. – MisterH Aug 04 '17 at 08:56
  • Yes, (cx,cy) are coordinates of the COG of the entire plot – MBo Aug 04 '17 at 09:01
  • Then why is it that when you take for x<-seq(0,18,length.out=18), it does not lie at the point with coordinates (12,6)? It is known that the centroid of a right triangle (with uniform density) is at (base/3,height/3)? – MisterH Aug 04 '17 at 12:14
  • I've got 12.33 6.17 for this data (note that stairs are not exact triangle). For range 18000 I see result 12000.33 6000.17 – MBo Aug 04 '17 at 13:04
  • Notice that as a default (when the width of each bar is 1), the center of each bar is at `(i+ 0.5)` for `i = 1,2,...`. Therefore 12.17 should be correct. See my code. – Martin Schmelzer Aug 04 '17 at 15:24
  • @Martin Schmelzer It's subject of convention. We can consider bars centered at i value, or left edge at i. – MBo Aug 04 '17 at 16:44
  • No doubt, yes but since he is using R and using the default arguments for barplot it is 12.17 .... – Martin Schmelzer Aug 04 '17 at 16:46
  • Yes, you are both correct: seq(0,18,length.out=180000) yields 120000.2 & 6.000017. – MisterH Aug 05 '17 at 10:10