3

I have an R shiny page, and am filtering the data based on clicking a pie graph. It would be great if I could trigger the same filtering event from clicking legend entries, but I can't seem to find the event trigger, so it just filters that chart without propagating to the other charts. Is a legend click event accessible?

library(data.table)
library(plotly)
library(shiny)

dt = as.data.table(mtcars)


ui <- fluidPage(
  plotlyOutput("pie1"),
  plotlyOutput("pie2")
)


server <- function(input, output){

  gearDT = reactive({
    return(dt[,.N,by=gear])
  })

  cylDT = reactive({
    return(dt[,.N,by=cyl])
  })

  output$pie1 <- renderPlotly({

    plot_ly(gearDT(), labels = ~gear, values = ~N, type = "pie") %>%
      layout(showlegend = TRUE)


  })

  output$pie2 <- renderPlotly({

    plot_ly(cylDT(), labels = ~cyl, values = ~N, type = "pie")  %>%
      layout(showlegend = TRUE)


  })
}

shinyApp(ui = ui, server = server)
Matt
  • 518
  • 2
  • 5
  • 19
  • 1
    Could you please prepare a [minimal reproducible example](https://stackoverflow.com/questions/5963269/how-to-make-a-great-r-reproducible-example)? If you illustrate your problem more completely and demonstrate the steps you've taken so far, then you are likely to receive more productive answers – Kevin Arseneau Nov 21 '17 at 06:47
  • @KevinArseneau Thanks for the advice Kevin, I've attached an example, you may have already answered my question though. – Matt Nov 21 '17 at 19:15

3 Answers3

5

For future readers

Plotly now has created an event called plotly_relayout. This event is triggered on layout changes. Clicking on the legend is one of these changes.

One of the variables in this event is called hiddenlabels. This variable contains all the names of the legend traces that are hidden.

observe({
    relayout <- event_data("plotly_relayout")
    hidden_labels <- relayout$hiddenlabels
    print(hidden_labels)
  })

EDIT

Check event when clicking a name in the legend of a plotly's graph in R Shiny if plotly_relayout is not working for you.

Wilmar van Ommeren
  • 7,469
  • 6
  • 34
  • 65
  • Wilmar, I just tried to work with this observer, seeing I already use a few of these observe plotly events for clicking particles in the plot, zooming, and such, but when I put this relayout code in my app, it only seems to listen to zoom and rotate, and only contains $scene.camera elements. Any clues? Perhaps you could provide a working example? – Mark Feb 22 '19 at 07:54
  • Thanks for the fast response, I looked at that too, no example of looking at legend clicks there. I posted a question with a demo app that shows the non-working situation. Would appreciate your input if you have any, thanks! https://stackoverflow.com/questions/54822671/r-plotly-how-to-observe-hiding-traces-through-clicks-in-legend-in-scatter-plot – Mark Feb 22 '19 at 08:12
  • I added the link to the answer for your question in my post. Good luck! – Wilmar van Ommeren Feb 22 '19 at 08:43
2

Short answer is YES, but with caveats and it will take more work to implement than I will fully cover in my answer.

The plotly package includes the event_data function. In the documentation, you will find three events covered:

  1. plotly_hover
  2. plotly_click
  3. plotly_selected

The examples for using these are in the link above. They do not cover interaction with the legend specifically, rather the data in the plot proper.

However, there is the postMessage API provided by plotly, which is what shiny and other frameworks like jupyter use to capture events. I have not gone through the documentation to highlight the events relating to the legend. This would require some javascript, which you could access in R using shinyjs.

The effort may be more than you are willing to put in to achieve this directly. If it is not essential for you to go down this path then I believe you will get a better return on your time using the shiny input and reactive functions to filter and redraw.

edit with your updated example

Your edit to the question reveals a little more to your problem. Although it is not reproducible, manuf is not a colname to mtcars (I'm assuming you assigned that name to the rownames). If your legend is shared between plots, you could use a subplot grouped legend as shown in the documentation.

further revision

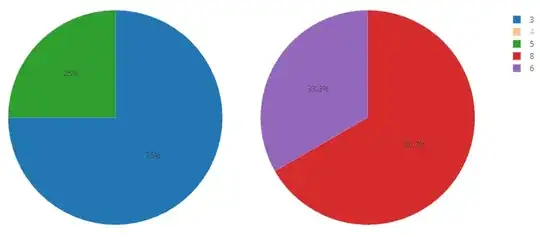
Pie charts behave a little strangely in subplots, see this and the docs. The following code gives you a minimal reproducible solution.

dt <- as.data.table(mtcars)

ui <- fluidPage(plotlyOutput("pie"))

server <- function(input, output){

  gearDT <- reactive({return(dt[,.N,by=gear])})  
  cylDT <- reactive({return(dt[,.N,by=cyl])})

  output$pie <- renderPlotly({

    plot_ly() %>%
      add_pie(data = gearDT(), labels = ~gear, values = ~N, name = "gear",
              domain = list(x = c(0, 0.5), y = c(0, 1))) %>%
      add_pie(data = cylDT(), labels = ~cyl, values = ~N, name = "cyl",
              domain = list(x = c(0.5, 1), y = c(0, 1))) %>%
      layout(showlegend = TRUE,
             xaxis = list(showgrid = FALSE, zeroline = FALSE, showticklabels = FALSE),
             yaxis = list(showgrid = FALSE, zeroline = FALSE, showticklabels = FALSE))

  })

}

shinyApp(ui = ui, server = server)

And screenshot showing a common element filtered from both traces (4).

enter image description here

While your original question involved shiny and I incorporated that in my answer. The plotly chart is independent of this and would function perfectly well as an independent widget with the same functionality. Useful perhaps if you intended this in an rmarkdown document and otherwise don't need to depend on shiny.

Kevin Arseneau
  • 6,186
  • 1
  • 21
  • 40
  • Thanks Kevin, that is probably more than I'm willing to take on at the moment, but I'll keep it in mind. – Matt Nov 21 '17 at 18:36
  • I must have modified mtcars somewhere along the way, have fixed that up. Subplots might be my way forward, thanks again. – Matt Nov 22 '17 at 01:36
0
library(dygraphs)
library(datasets)


ui <- shinyUI(fluidPage(

    mainPanel(
      dygraphOutput("dygraph"),dygraphOutput("dygraph1"),dygraphOutput("dygraph2")
    )
  )
)

server <- shinyServer(function(input, output) {


  output$dygraph <- renderDygraph({
    dygraph(ldeaths, main = "All", group = "lung-deaths")
  })
  output$dygraph1 <- renderDygraph({
    dygraph(mdeaths, main = "Male", group = "lung-deaths")
  })
  output$dygraph2 <- renderDygraph({
    dygraph(fdeaths, main = "Female", group = "lung-deaths")
  })
})

shinyApp(ui = ui, server = server)
Rahul Agarwal
  • 4,034
  • 7
  • 27
  • 51
  • 1
    Not sure if that answers the question. Could you give a little bit of explanation? – Maximilian Peters Nov 21 '17 at 05:44
  • 1
    My understanding of the question is that he wants to filter the pie chart using legends and not by clicking the graph. The above code does the same by using plotly package. – Rahul Agarwal Nov 21 '17 at 05:57
  • @Rahul My problem is that I want other graphs to also be filtered by clicks on the legend of another graph. This solution will only filter that graph, as far as I'm aware. – Matt Nov 21 '17 at 07:44
  • 1
    You can use dygraphs in that case . I have updated my answer for that case – Rahul Agarwal Nov 21 '17 at 07:49
  • Thanks Rahul, look's like an interesting package! It seems to be only time series data though, which isn't my primary concern. – Matt Nov 21 '17 at 18:34