To give you some background as to what I'm doing: I'm trying to quantitatively record variations in flow of a compressible fluid via image analysis. One way to do this is to exploit the fact that the index of refraction of the fluid is directly related to its density. If you set up some kind of image behind the flow, the distortion in the image due to refractive index changes throughout the fluid field leads you to a density gradient, which helps to characterize the flow pattern.
I have a set of routines that do this successfully with a regular 2D pattern of dots. The dot pattern is slightly distorted, and by comparing the position of the dots in the distorted image with that in the non-distorted image, I get a displacement field, which is exactly what I need. The problem with this method is resolution. The resolution is limited to the number of dots in the field, and I'm exploring methods that give me more data.
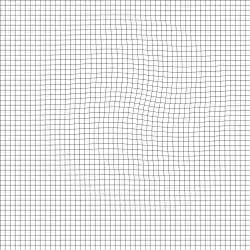
One idea I've had is to use a regular grid of horizontal and vertical lines. This image will distort the same way, but instead of getting only the displacement of a dot, I'll have the continuous distortion of a grid. It seems like there must be some standard algorithm or procedure to compare one geometric grid to another and infer some kind of displacement field. Nonetheless, I haven't found anything like this in my research.
Does anyone have some ideas that might point me in the right direction? FYI, I am not a computer scientist -- I'm an engineer. I say that only because there may be some obvious approach I'm neglecting due to coming from a different field. But I can program. I'm using MATLAB, but I can read Python, C/C++, etc.
Here are examples of the type of images I'm working with:
Regular: Distorted:
 --------