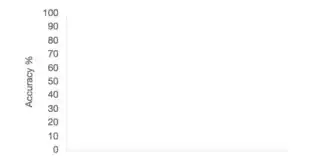
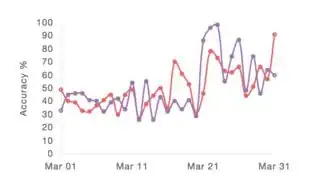
I created an Angular 1.6 platform that uses Chart JS 2.7.1.
The line charts render fine on Google Chrome 64.0, but not on Safari 10.1.2 or Firefox 58.0.2.
ChartJS docs show support for
Chrome 50+
Firefox 45+
Internet Explorer 11
Edge 14+
Safari 9+
The only error I get is in Firefox: ReferenceError: lso is not defined, which has nothing to do with ChartJS:
Bar Charts and Pie Charts are loading fine in both Safari and Firefox; it's only Line Charts that seem to be problematic. The axes are rendered, but no lines appear (nor does the X axis):
In Chrome:
This SO post says
you have to put your script after the canvas declaration
My directive loads the chart onto a page, with its own template HTML. The template HTML should load before the javascript (I'm not sure that it is).
Would I have to force the directive to wait until after its template has loaded (as shown here)? I feel like Angular would complain already since it wouldn't be able to access the <canvas> element if the HTML wasn't loaded. I've tried this, and it doesn't fix the issue:
angular.element(document).ready(function() {
    run chart
    ...
});
lineChart.html:
<div class="charts chart_{{chartId}}">
  <p class="subheading margin-bottom">stuff</p>
  <canvas id="line_chart_{{chartId}}"></canvas>
</div>
lineChart.js:
angular
    .module('LD')
    .directive('lineChart',['$rootScope', function ($rootScope) {
        return {
            restrict: 'E',
            scope: {
                data: '=',
                chartId: '@',
                ...
            },
            templateUrl: '/html/directives/charts/lineChart.html',
            link: function(scope, elem, attr) {
                var lineChart;

                // Watch for date changes affect incoming datasets. Redraw charts as needed
                scope.$watch('data', function(n, o) {
                    if (!scope.data) {
                        return;
                    }
                    drawChart();
                });

                var drawChart = function() {
                    if (lineChart || typeof lineChart !== 'undefined') {
                        lineChart.destroy();
                    }

                    var ctx = document.getElementById(`line_chart_${scope.chartId}`).getContext('2d');
                    ...
What would cause this?
EDIT:
In Firefox, I am getting the following warning:
Use of mozImageSmoothingEnabled is deprecated. Please use the unprefixed imageSmoothingEnabled property instead.
When I console.log(lineChart), I see this property:
where lineChart is:
lineChart = new Chart(ctx, {
    type: 'line',
    data : scope.data,
    options : getOptions()
});
Could this have something to do with it?


