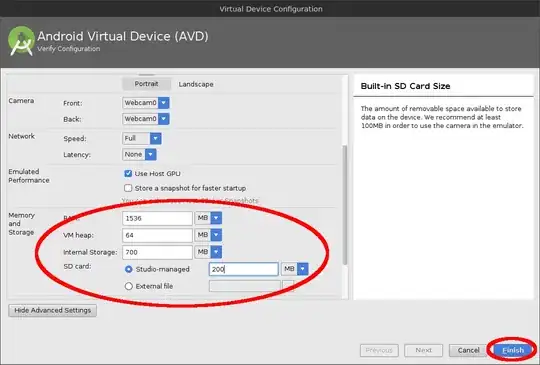
I'm using the MS asp.net charting controls. And I'm using the radar chart to draw some values, but for some reason, the lines of the X-axis doesn't really meet in the middle.
I have set the LineWidth = 1, but the line still takes like 2 pixels and some of the markers are totally off, or maybe it's the line that's totally off.
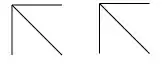
Maybe my text is a little bit off as well, so please see picture and hopefully you'll understand my problem. =)
Code that generates the chart:
// Populate series data
Chart chart1 = new Chart();
chart1.ChartAreas.Add(new ChartArea("ChartArea1"));

chart1.Height = new Unit(380);
chart1.Width = new Unit(880);
//chart1.AntiAliasing = AntiAliasingStyles.Graphics;
//chart1.BackColor = Color.Transparent;
chart1.Customize += new EventHandler(Chart_Customize);

// Show as 3D
chart1.ChartAreas["ChartArea1"].Area3DStyle.Enable3D = false;
chart1.ChartAreas["ChartArea1"].AxisY.IntervalAutoMode
    = IntervalAutoMode.FixedCount;
chart1.ChartAreas["ChartArea1"].AxisY.Interval = 10;
chart1.ChartAreas["ChartArea1"].AxisY.Maximum = 100;

chart1.ChartAreas["ChartArea1"].AxisY.IsReversed = true;

chart1.ChartAreas[0].AxisY.LineWidth = 1;
chart1.ChartAreas[0].AxisY.MajorGrid.LineColor = Color.Gray;
chart1.ChartAreas[0].AxisY.LineColor = Color.Gray;
chart1.ChartAreas[0].AxisY.MajorTickMark.Enabled = false;

List<string> names = new List<string>();
int namecounter = 1;
foreach (var p in Model.Participants)
{
  if (SessionHandle.ShowNamesInDiagrams)
    names.Add(p.Person.Name);
  else
    names.Add(namecounter.ToString());
  namecounter++;
}

#region firstresult
if (SessionHandle.ShowFirstResult)
{
  chart1.Series.Add(new Series("FirstResult"));
  List<double> firstresult = new List<double>();
  foreach (var p in Model.Participants)
  {
    var resultSummary = from r in Model.ResultSummary
                        where r.userID == p.ParentID && Model
                            .Modules
                            .Where(x => x.hasResult)
                            .ToList()
                            .Exists(x => x.ID == r.moduleID)
                        select r;
    firstresult.Add(resultSummary.Sum(x => x.scorePercent)
                    / Model.Modules.Where(x => x.hasResult).Count());
  }

  chart1.Series["FirstResult"].Points.DataBindXY(names, firstresult);
  // Set radar chart type
  chart1.Series["FirstResult"].ChartType = SeriesChartType.Radar;

  // Set radar chart style (Area, Line or Marker)
  chart1.Series["FirstResult"]["RadarDrawingStyle"] = "Marker";
  chart1.Series["FirstResult"].Color = Color.DarkBlue;
  chart1.Series["FirstResult"].MarkerImage
      = Url.Content("~/Content/Images/firstresult.png");

  // Set circular area drawing style (Circle or Polygon)
  chart1.Series["FirstResult"]["AreaDrawingStyle"] = "Circle";

  // Set labels style (Auto, Horizontal, Circular or Radial)
  chart1.Series["FirstResult"]["CircularLabelsStyle"] = "Horizontal";
}
#endregion