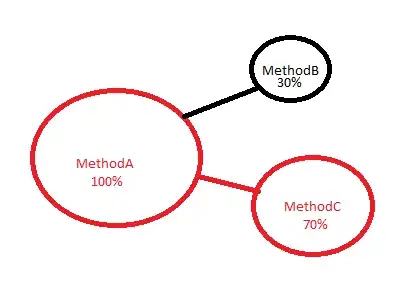
I want to display a 'flow' chart of a process showing time spent in children relative to the parent. For example, say that I have MethodA which calls MethodB and MethodC. 30% of the time relative to MethodA in MethodB and 70% in MethodC. I want to display something like this:
I know this is a sort of vague question, so to narrow the scope, I don't know what kind of chart this might be. What kind of Libraries might provide the capability to display this type of chart?