I have been trying to run the script of this Wikipedia chart showing US unemployment.
The data is from http://download.bls.gov/pub/time.series/ln/ln.data.1.AllData & http://download.bls.gov/pub/time.series/ln/ln.series
    cat("Loading table -- might take some time\n");
    u <- read.table("ln.data.1.AllData", header=T, fill=T)
    u$time <- u$year + (as.numeric(u$period) - 1) / 12

    cat("Processing -- might take some time\n");
    u1 = subset(u, series_id == "LNS13025670")
    u2 = subset(u, series_id == "LNS14023621")
    u3 = subset(u, series_id == "LNS14000000")
    u4 = subset(u, series_id == "LNS13327707")
    u5 = subset(u, series_id == "LNS13327708")
    u6 = subset(u, series_id == "LNS13327709")

par(family="Times")
par(bty = "n")
plot(
    0,
    main = "Measurement of unemployment",
    ylim = c(0,18),
    xlim = c(1950, 2010),
    xlab = "Year",
    ylab = "Percentage",
    las = 1
);

grid()

pal = rainbow(8)
lines(value ~ time, u6, col=pal[6])
lines(value ~ time, u5, col=pal[5])
lines(value ~ time, u4, col=pal[4])
lines(value ~ time, u3, col=pal[3])
lines(value ~ time, u2, col=pal[2])
lines(value ~ time, u1, col=pal[1])

legend(
    "topleft",
    rev(c(
        "U1: Percent Of Civilian Labor Force Unemployed 15 Weeks and over",
        "U2: Unemployment Rate - Job Losers",
        "U3: Unemployment Rate",
        "U4: All of U3, plus discouraged workers",
        "U5: All of U4, plus marginally attached workers",
        "U6: All of U5, plus total employed part time for economic reasons"
    )),
    col = rev(pal[1:6]),
    bty = 'n',
    lty = 1
)

dev.copy(svg, "US Unemployment measures.svg", width=8, height=6)
dev.off()
Despite it's the unmodified source code form Wikimedia Commons, the lines are all bogus:
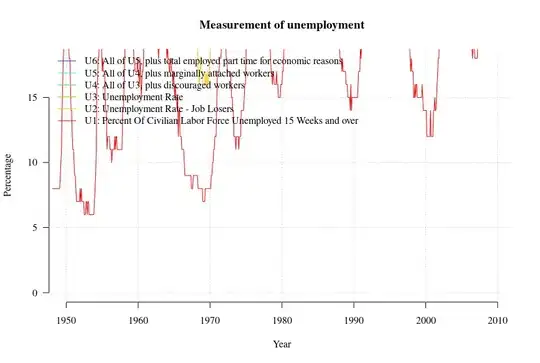
What's wrong with the R script?
Is it because u1-u6 are falsely being interpreted as factors?