I read the whole documentation on profile face heatmap generation but I could not find any way to add labels to the heatmap produced by ete3. For example in the following code, the 7 columns of the heatmap have names 'Marker1' to 'Marker7'. Is there any way these names to be added to the heatmap produced by ete3, something like the 'labels' option available for 'BarChartFace'? or the only way is to port the tree to matplotlib and add the labels over there?
from ete3 import Tree, TextFace, NodeStyle, TreeStyle, faces, AttrFace, ClusterTree, ProfileFace
PhenoDict={'a':1,'b':0,'c':1}
matrix = """
#Names\tmarker1\tmarker2\tmarker3\tmarker4\tmarker5\tmarker6\tmarker7
a\t1\t-1\t1\t-1\t-1\t-1\t1
b\t-1\t-1\t1\t1\t-1\t-1\t1
c\t1\t1\t1\t-1\t1\t1\t1
"""

t=ClusterTree( "((a,b),c);" , text_array=matrix)

#Defining a function to generate textFace for each node

def ColorCodedNode (node):
    if node.is_leaf():
        ColorCode=PhenoDict[node.name]

        if ColorCode == 0:
            faces.add_face_to_node(AttrFace('name',fsize=20,fgcolor='blue'), node, column=0,aligned=True)
column=1,position='aligned')
            faces.add_face_to_node(ProfileFace(1, -1, 0, width=200, height=40, style='heatmap', colorscheme=2),node,column=1,position='aligned')
        elif ColorCode == 1:
            faces.add_face_to_node(AttrFace("name",fsize=20,fgcolor='red'), node, column=0,aligned=True)
            faces.add_face_to_node(ProfileFace(1, -1, 0, width=200, height=40, style='heatmap', colorscheme=2),node,column=1,position='aligned')


ts = TreeStyle()
ts.layout_fn= ColorCodedNode
ts.show_scale = False
ts.show_leaf_name = False
ts.draw_guiding_lines=True
t.show(tree_style=ts)
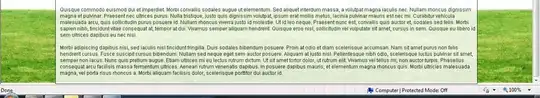
Now it produces a tree like this, but I need to add labels to each column of heatmap.