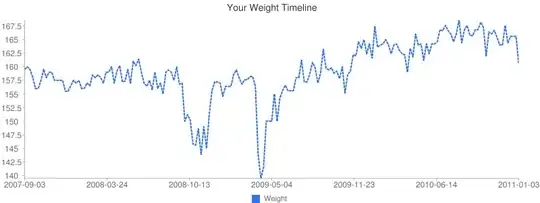
I am trying to plot candlestick and simple moving average data using plot.ly as you see in the chart, there is empty value line plotted where there is no date/price data available actually. the data for this chart is also shown.
So in chart, you can see that the non-trading hours are also plotted. How to avoid this?