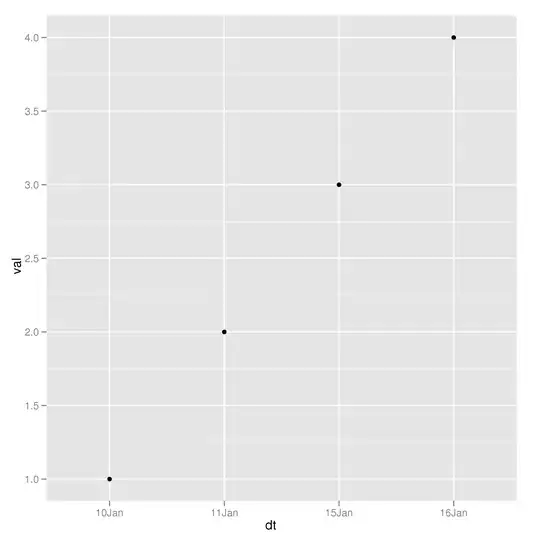
Say we have the following simple data-frame of date-value pairs, where some dates are missing in the sequence (i.e. Jan 12 thru Jan 14). When I plot the points, it shows these missing dates on the x-axis, but there are no points corresponding to those dates. I want to prevent these missing dates from showing up in the x-axis, so that the point sequence has no breaks. Any suggestions on how to do this? Thanks!
dts <- c(as.Date( c('2011-01-10', '2011-01-11', '2011-01-15', '2011-01-16')))
df <- data.frame(dt = dts, val = seq_along(dts))
ggplot(df, aes(dt,val)) + geom_point() +
        scale_x_date(format = '%d%b', major='days')